| January 2023ICR CONFERENCE 2023 |

| DISCLAIMERDisclaimer This investor presentation (this “Presentation”) is for informational purposes only. The information contained herein does not purport to be all-inclusive and none of BRC Inc. (“the Company”) or its respective affiliates makes any representation or warranty, express or implied, as to the accuracy, completeness or reliability of the information contained in this Presentation. The Company has not verified, and will not verify, any part of this Presentation. The recipient should make its own independent investigations and analyses of the Company and its own assessmentofall information and material provided, or made available, by the Company or any of its respective directors, officers, employees, affiliates, agents, advisors or representatives. This Presentation does not constitute a solicitation of a proxy, consent or authorization with respect to any securities. This Presentation shall also not constitute an offer to sell, a solicitation of an offer to buy, or a recommendation to purchase any securities. You should consult your own counsel and tax and financial advisors as to legal and related matters concerning the matters described herein, and, by accepting this Presentation, you confirm that you are not relying upon the information contained herein to make any decision. Forward-Looking Statements Certain statements in this Presentation may be considered forward-looking statements. Forward-looking statements generally relate to future events or the Company’s future financial or operating performance. For example, projections of future Revenue and Adjusted EBITDA and other metrics are forward-looking statements. In some cases, you can identify forward-looking statements by terminology such as “may”, “should”, “expect”, “intend”, “will”, “estimate”, “anticipate”, “believe”, “predict”, “potential”, “could”, “might”, “plan, “possible”, “project”, “would” or “continue”, or the negatives of these terms or variations of them or similar terminology. Such forward-looking statements are subject to risks, uncertainties, and other factors which could cause actual results to differ materially from those expressed or implied by such forward looking statements. These forward-looking statements are based upon estimates and assumptions that, while considered reasonable by the Company and its management,are inherently uncertain and are inherently subject to risks, variability and contingencies, many of which are beyond the Company’s control. Some factors that could cause actual results to differ include: failure to recognize the anticipated benefits of the outcome of any legal proceedings that business combination, which may be, competition and our ability to grow and manage growth profitably and retain our key employees; negative publicity impacting our brand and reputation, which may adversely impact our operating results; failure by us to maintain our message as a supportive member of the veteran and military communities and any other factors which may negatively impact the perception of our brand; our limited operating history, which may make it difficult to successfully execute our strategic initiatives and accurately evaluate future risks and challenges; failed marketing campaigns, which may cause us to incur costs without attracting new customers or realizing higher revenue; failure to attract new customers or retain existing customers; risks related to the use of social media platforms, including dependence on third-party platforms; failure to provide high-quality customer experience, which may impact our brand; decrease in success of the direct to consumer revenue channel; loss of one or more of co-manufacturers; failure to effectively manage or distribute our products through our wholesale business partners; failure by third parties involved in the supply chain of coffee, store supplies or merchandise to produce or deliver products; changes in the market for high-quality Arabica coffee beans and other commodities; fluctuations in costs and availability of real estate, labor, raw materials, equipment, transportation or shipping; loss of confidential data from customers and employees, which may subject us to litigation, liability or reputational damage; failure to successfully compete with other producers and retailers of coffee; failure to successfully open new retail coffee shops; failure to properly manage our rapid growth and relationships with various business partners; failure to protect against software or hardware vulnerabilities; failure to build brand recognition using our intellectual properties; shifts in consumer spending, lack of interest in new products or changes in brand perception upon evolving consumer preferences and tastes; failure to adequately maintain food safety or quality and comply with food safety regulations; failure to successfully integrate into new domestic and international markets; risks related to leasing space subject to long-term non-cancelable leases and with respect to real property; failure of our franchise partners to successfully manage their franchise; failure to raise additional capital to develop the business; risks related to the COVID-19 pandemic, including supply chain disruptions; the loss of one or more of our executive officers and other key employees; failure to hire and retain qualified employees; failure to meet our goal of hiring 10,000 veterans; risks related to unionization of employees; failure to comply with federal state and local laws and regulations; and inability to maintain the listing of our Class A Common Stock on the New York Stock Exchange. The forward-looking statements contained in this Presentation are based on our current expectations and beliefs concerning future developments and their potential effects on us. There can be no assurance that future developments affecting us will be those that we have anticipated. These forward-looking statements involve a number of risks, uncertainties (some of which are beyond our control) or other assumptions that may cause actual results or performance to be materially different from those expressed or implied by these forward-looking statements. Should one or more of these risks or uncertainties materialize, or should any of the assumptions prove incorrect, actual resultsmay vary in material respects from those projected in these forward-looking statements. We will not undertake any obligation to update or revise any forward-looking statements, whether as a result of new information, future events or otherwise, except as may be required under applicable securities laws. For additional information about the factors that could cause actual results to differ materially from forward-looking statements, please see the Company's documents filed or to be filed with the Securities and Exchange Commission (the “SEC”), including the annual report on Form 10-K and the quarterly reports on Form 10-Q filed by the Company with the SEC. You should not place undue reliance on forward-looking statements, which speak only as of the date of this release. The recipient agrees that it shall not seek to sue or otherwise hold the Company or any of its respective directors, officers, employees, affiliates, agents, advisors or representatives liable in any respect for the provision of this Presentation, the information contained in this Presentation, or the omissionofany information from this Presentation. Black Rifle Coffee Company1 |
| DISCLAIMER (CONT’D) Non-GAAP Financial Measures This Presentation includes projections of certain financial measures not presented in accordance with generally accepted accounting principles (“GAAP”) including, but not limited to, EBITDA, EBITDA Margin, Adjusted EBITDA, Adjusted EBITDA Margin, Gross Profit, Average Unit Volume (“AUV”) and certain ratios and other metrics derived therefrom. These non-GAAP financial measures are not measures of financial performance in accordance with GAAP and may exclude items that are significant in understanding and assessing the Company’s financial results. Accordingly, the non-GAAP financial measures we use and refer to should not be viewed as a substitute for performance measures derived in accordance with GAAP or as a substitute for a measure of liquidity. Our definitions of EBITDA and Adjusted EBITDA described below are specific to our business and you should not assume that they are comparable to similarly titled financial measures of other companies. We define EBITDA as net income (loss) before interest, state income taxes, depreciation and amortization expense. We define Adjusted EBITDA as EBITDA, as adjusted for equity-based compensation, system implementation costs, transaction expenses, executive recruiting, severance and sign-on bonus, write-off of site development costs and outpost pre-opening expenses. When used in conjunction with GAAP financial measures, we believe that EBITDA and Adjusted EBITDA are useful supplemental measures of operating performance because it facilitates comparisons of historical performance by excluding non- cash items such as equity-based payments and other amounts not directly attributable to our primary operations, such as the impact of system implementation, acquisitions, disposals, executive searches, executive severance, non- routine investigations, litigation and settlements. Adjusted EBITDA is also a key metric used internally by our management to evaluate performance and develop internal budgets and forecasts. EBITDA and Adjusted EBITDA have limitations as an analytical tool and should not be considered in isolation or as a substitute for analyzing our results as reported under GAAP and may not provide a complete understanding of our operating results as a whole. Some of these limitations are (i) they do not reflect changes in, or cash requirements for, our working capital needs, (ii) they not reflect our interest expense or the cash requirements necessary to service interest or principal payments on our debt, (iii) they do not reflect our tax expense or the cash requirements to pay our taxes, (iv) they do not reflect historical capital expenditures or future requirements for capital expenditures or contractual commitments, (v) although equity-based compensation expenses are non-cash charges, we rely on equity compensation to compensate and incentivize employees, directors and certain consultants, and we may continue to do so in the future and (vi) although depreciation, amortization and impairments are non-cash charges, the assets being depreciated and amortized will often have to be replaced in the future, and these non-GAAP measures do not reflect any cash requirements for such replacements.Preliminary Estimates The estimated results in this Investor Presentation represent the Company’s preliminary estimates of certain financial results for the year ended December 31, 2022, based on currently available information. The Company has not yet finalized its results for this period and its consolidated financial statements as of and for the year ended December 31, 2022 are not currently available. The Company’s actual results remain subject to the completion of the quarter- end closing process as well as a review by management and the Company’s board of directors, including the audit committee. While carrying out such procedures, the Company may identify items that require it to make adjustments to the preliminary estimates of its results set forth herein. As a result, the Company’s actual results could be different from those set forth herein and the differences could be material. Therefore, a reader should not place undue reliance on these preliminary estimates of the Company’s results. The preliminary estimates of the Company’s results included herein have been prepared by, and are the responsibility of, the Company’s management. The Company’s independent auditors have not audited, reviewed or compiled such preliminary estimates of the Company’s results. The preliminary estimates of certain financial results presented herein should not be considered a substitute for the information to be filed with the Securities and Exchange Commission in the Company’s Annual Report on Form 10-K for the year ended December 31, 2022 once it becomes available.Use of Projections This Presentation contains financial forecasts with respect to the Company’s projected financial results, including Revenue and Adjusted EBITDA, for the Company’s fiscal years through 2023. The Company’s independent auditors have not audited, reviewed, compiled or performed any procedures with respect to the projections for the purpose of their inclusion in this Presentation, and accordingly, they did not express an opinion or provide any other form of assurance with respect thereto for the purpose of this Presentation. These projections should not be relied upon as being necessarily indicative of future results. The assumptions and estimates underlying the prospective financial information are inherently uncertain and are subject to a wide variety of significant business, economic and competitive risks and uncertainties that could cause actual results to differ materially from those contained in the prospective financial information. Accordingly, there can be no assurance that the prospective results are indicative of the future performance of the Company or that actual results will not differ materially from those presented in the prospective financial information. Inclusion of the prospective financial information in this Presentation should not be regarded as a representation by any person that the results contained in the prospective financial information will be achieved.Industry and Market Data This Presentation also contains estimates and other statistical data made by independent parties and by the Company relating to market size and growth and other data about the Company’s industry. This data involves a number of assumptions and limitations, and you are cautioned not to give undue weight to such estimates. In addition, projections, assumptions, and estimates of the future performance of the markets in which the Company operates are necessarily subject to a high degree of uncertainty and risk. Any trademarks, service marks, trade names and copyrights of the Company and other companies contained in this Presentation are the property of their respective owners.Black Rifle Coffee Company 2 |
| WE ARE AMERICA’S COFFEEOur Mission Black Rifle Coffee Serves Premium Coffee and Content to Active Military, Veterans, First Responders, and Those Who Love America 3 Black Rifle Coffee Company |

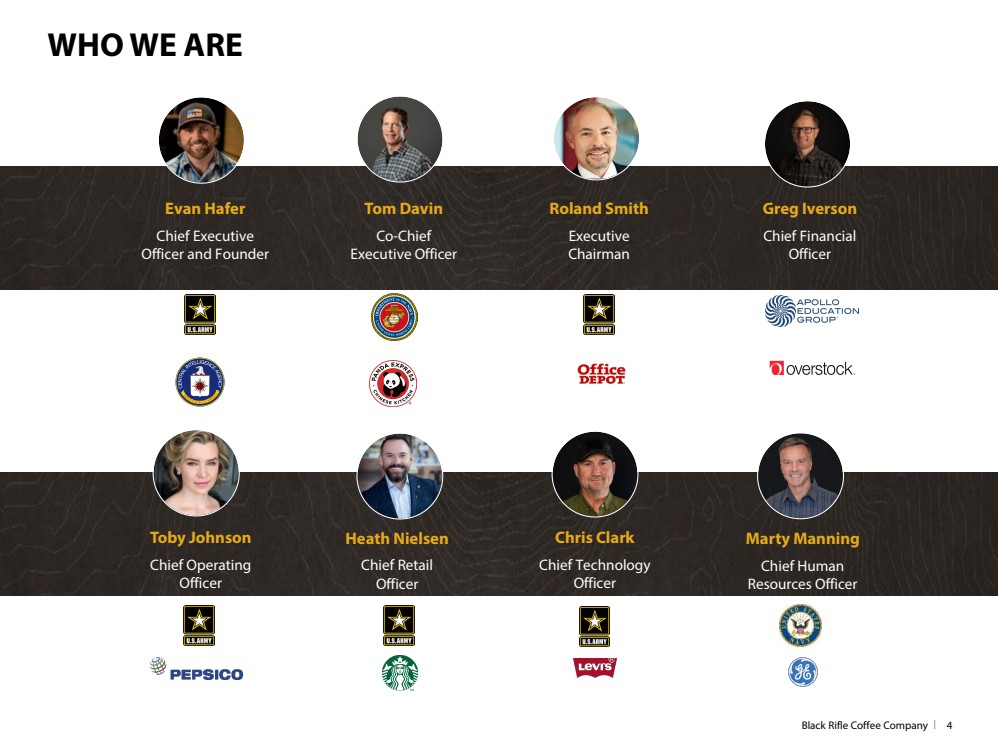
| WHO WE ARE Black Rifle Coffee Company4 Toby JohnsonChief Operating Officer Evan HaferChief Executive Officer and Founder Greg IversonChief FinancialOfficer Chris ClarkChief Technology Officer Heath NielsenChief Retail Officer Tom Davin Co-ChiefExecutive Officer Marty ManningChief Human Resources Officer Roland SmithExecutive Chairman |
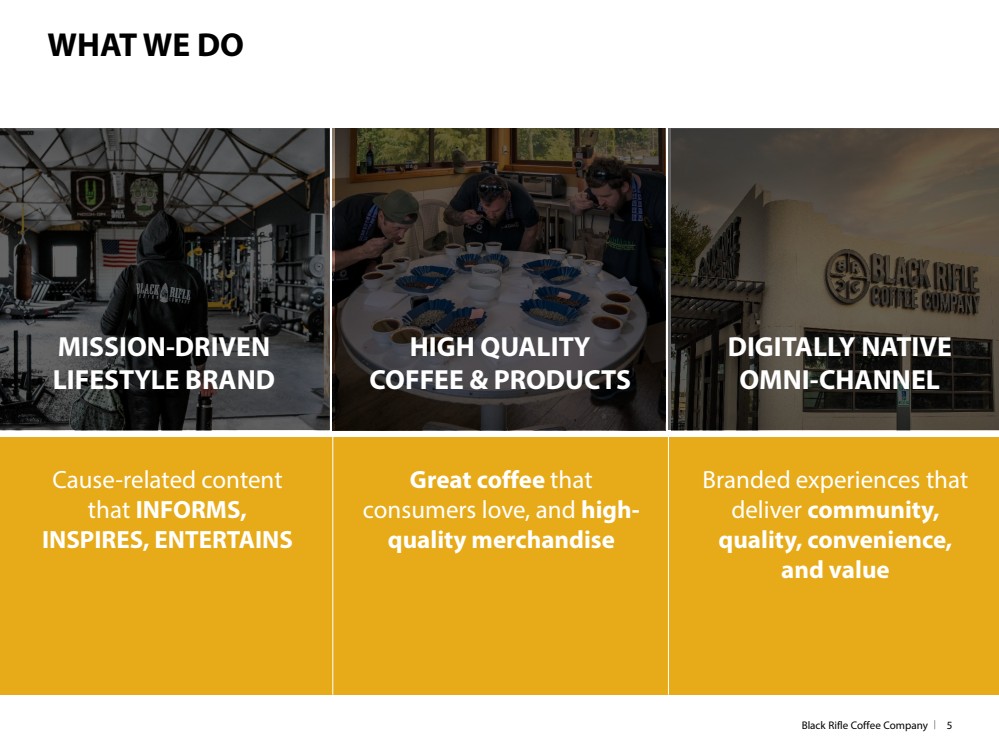
| WHAT WE DO Black Rifle Coffee Company5 Cause-related content that INFORMS, INSPIRES, ENTERTAINSGreat coffee that consumers love, and high-quality merchandiseBranded experiences that deliver community, quality, convenience, and value MISSION-DRIVEN LIFESTYLE BRAND DIGITALLY NATIVE OMNI-CHANNEL HIGH QUALITY COFFEE & PRODUCTS |
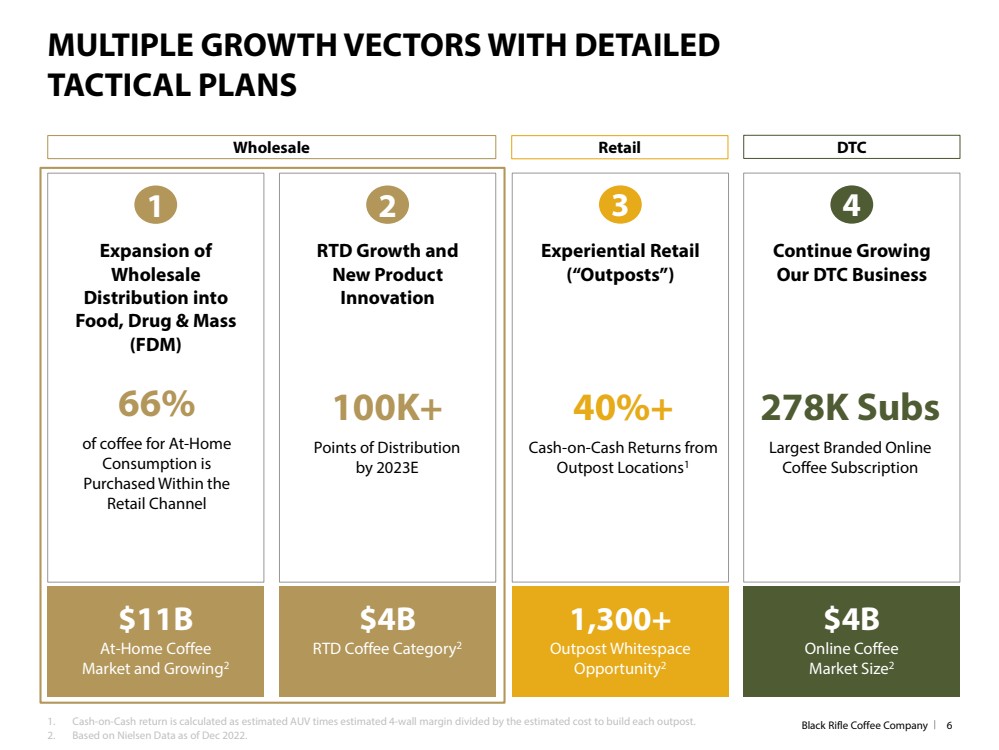
| MULTIPLE GROWTH VECTORS WITH DETAILED TACTICAL PLANS Black Rifle Coffee Company61.Cash-on-Cash return is calculated as estimated AUV times estimated 4-wall margin divided by the estimated cost to build each outpost.2.Based on Nielsen Data as of Dec 2022. 1 $11BAt-Home Coffee Market and Growing2Expansion of Wholesale Distribution into Food, Drug & Mass (FDM)66%of coffee for At-Home Consumption is Purchased Within the Retail Channel 2RTD Growth and New Product Innovation $4BRTD Coffee Category2100K+Points of Distribution by 2023E 3Experiential Retail (“Outposts”) 1,300+Outpost Whitespace Opportunity240%+Cash-on-Cash Returns from Outpost Locations1 4Continue Growing Our DTC Business $4BOnline Coffee Market Size2278K SubsLargest Branded Online Coffee Subscription Wholesale Retail DTC |
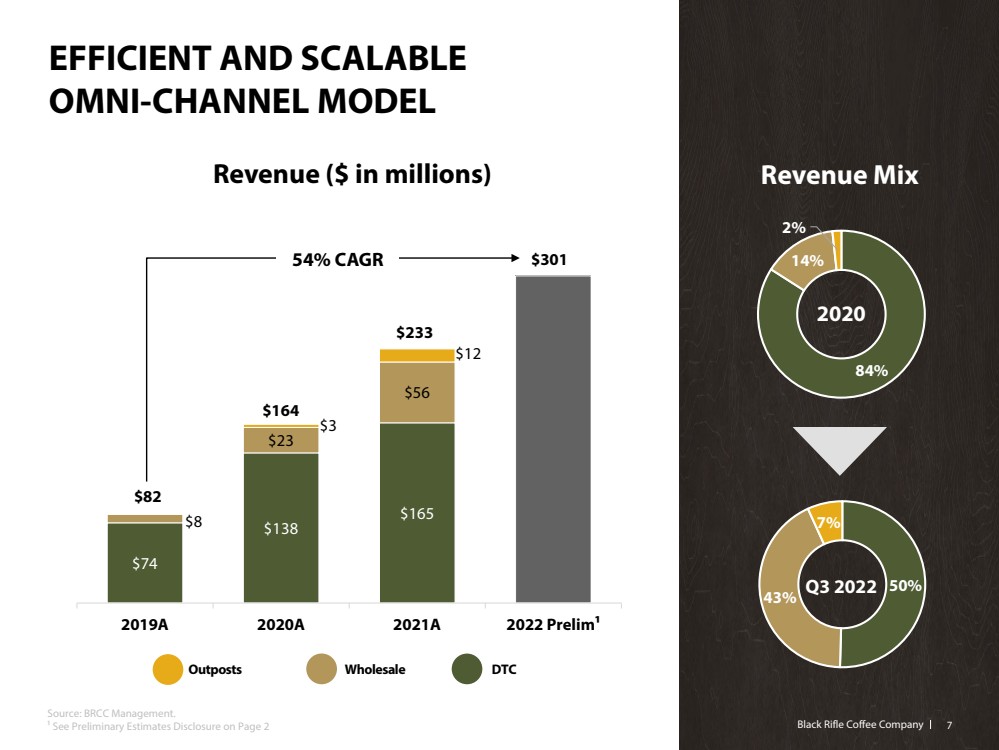
| Black Rifle Coffee Company Black Rifle Coffee Company EFFICIENT AND SCALABLEOMNI-CHANNEL MODEL 84%14%2% 50%43%7%Q3 20222020 $74$138$165$8$23$56$3$122019A2020A2021A2022 Prelim¹ 54% CAGR$301$233$164$82Revenue MixRevenue ($ in millions)Source: BRCC Management.¹ See Preliminary Estimates Disclosure on Page 2 7 OutpostsWholesaleDTC |
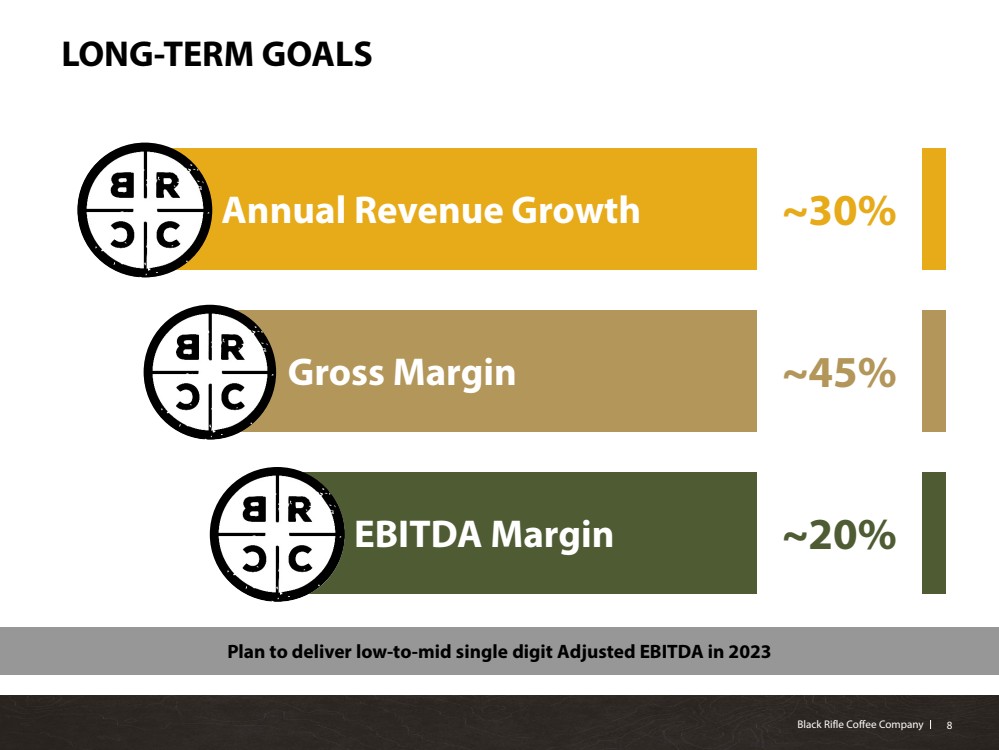
| Black Rifle Coffee Company Black Rifle Coffee Company Annual Revenue GrowthLONG-TERM GOALS8 Plan to deliver low-to-mid single digit Adjusted EBITDA in 2023 Gross Margin EBITDA Margin ~30% ~45% ~20% |
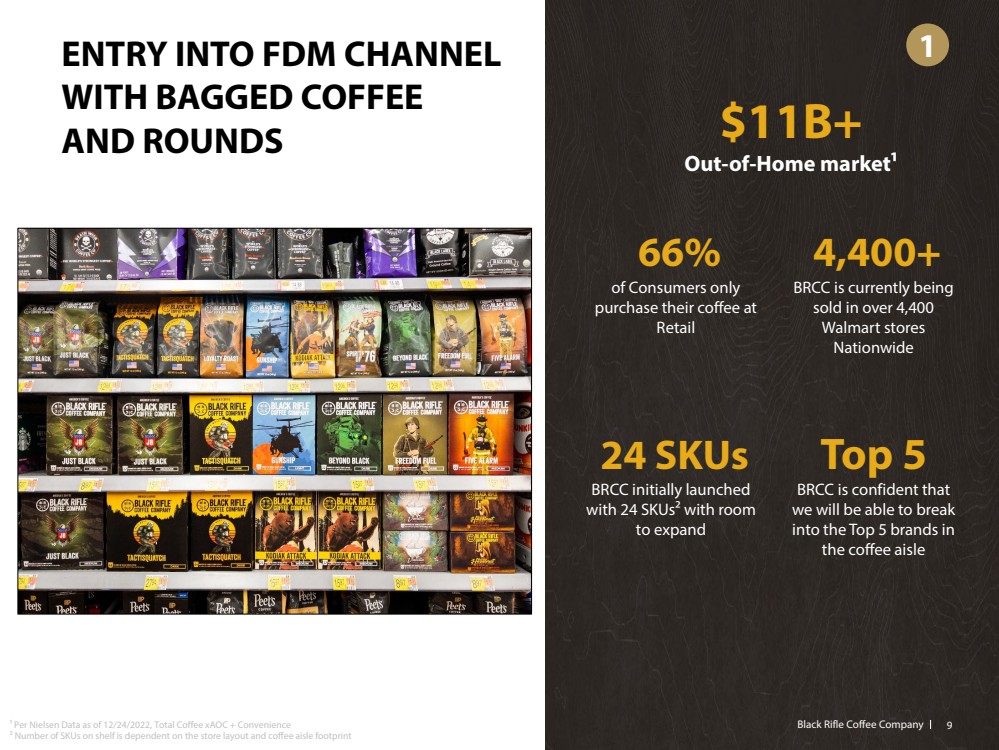
| Black Rifle Coffee Company Black Rifle Coffee Company ENTRY INTO FDM CHANNEL WITH BAGGED COFFEE AND ROUNDS 1 $11B+Out-of-Home market¹66%of Consumers only purchase their coffee at Retail4,400+BRCC is currently being sold in over 4,400 Walmart stores Nationwide24 SKUsBRCC initially launched with 24 SKUs² with room to expandTop 5BRCC is confident that we will be able to break into the Top 5 brands in the coffee aisle¹ Per Nielsen Data as of 12/24/2022, Total Coffee xAOC+ Convenience² Number of SKUs on shelf is dependent on the store layout and coffee aisle footprint9 |
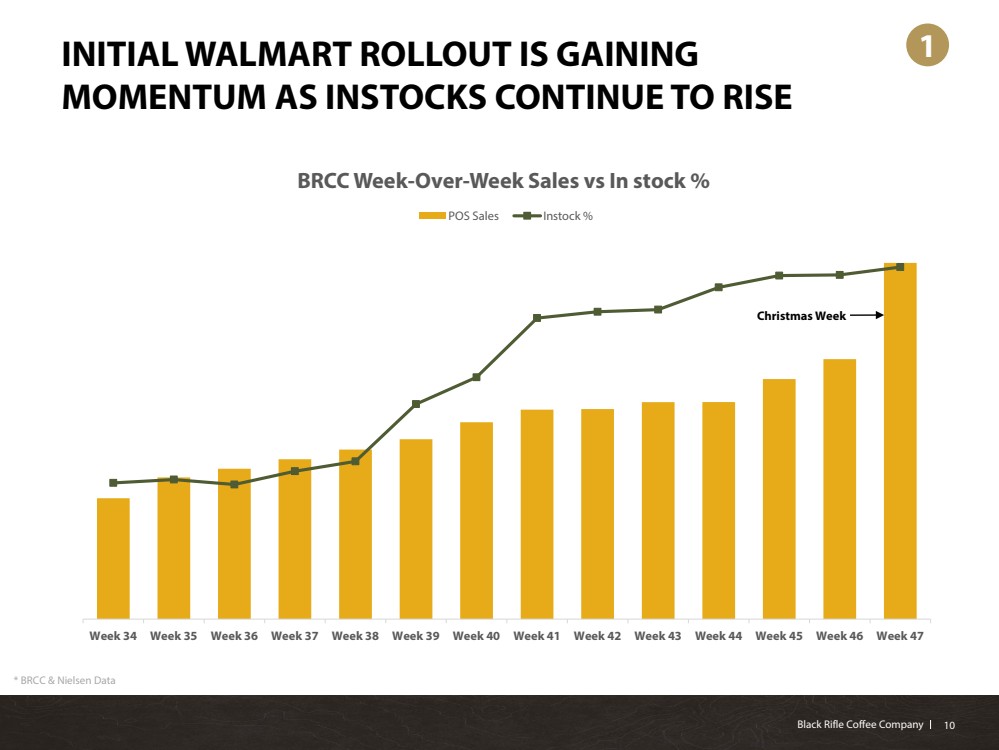
| Black Rifle Coffee Company Black Rifle Coffee Company INITIAL WALMART ROLLOUT IS GAINING MOMENTUM AS INSTOCKS CONTINUE TO RISE 50556065 707580859095100-25000025000075000012500001750000225000027500003250000Week 34Week 35Week 36Week 37Week 38Week 39Week 40Week 41Week 42Week 43Week 44Week 45Week 46Week 47BRCC Week-Over-Week Sales vs In stock % POS Sales Instock %Christmas Week 10* BRCC & Nielsen Data 1 |
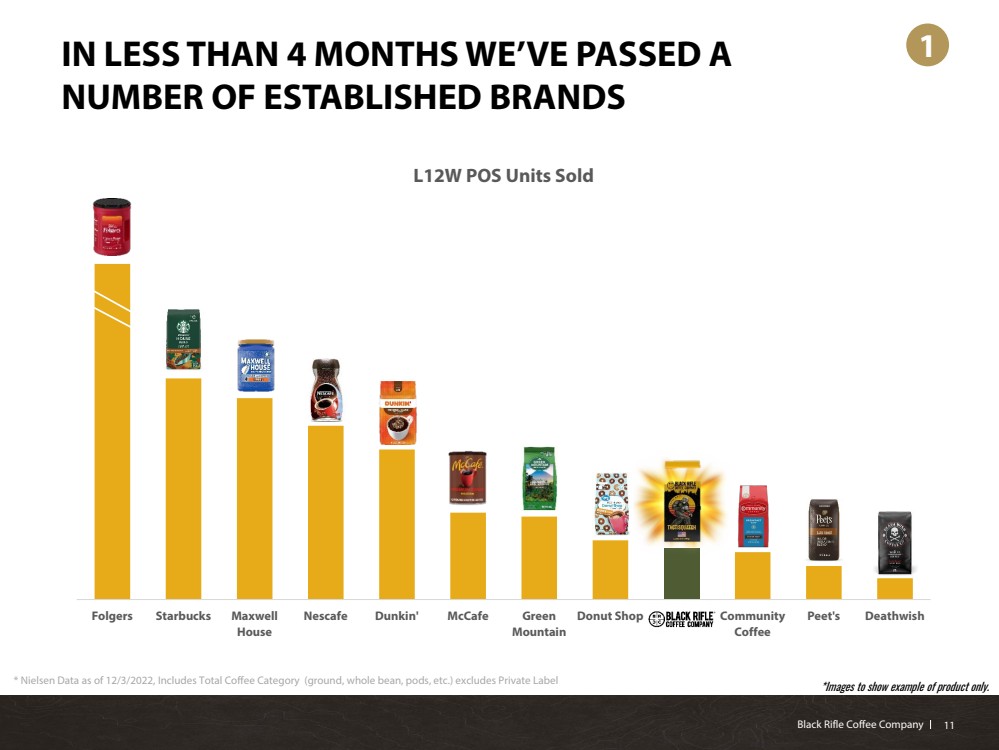
| Black Rifle Coffee Company Black Rifle Coffee Company IN LESS THAN 4 MONTHS WE’VE PASSED A NUMBER OF ESTABLISHED BRANDS * Nielsen Data as of 12/3/2022, Includes Total Coffee Category (ground, whole bean, pods, etc.) excludes Private Label FolgersStarbucksMaxwellHouseNescafeDunkin'McCafeGreenMountainDonut ShopBRCCCommunityCoffeePeet'sDeathwishL12W POS Units Sold *Images to show example of product only. 111 |
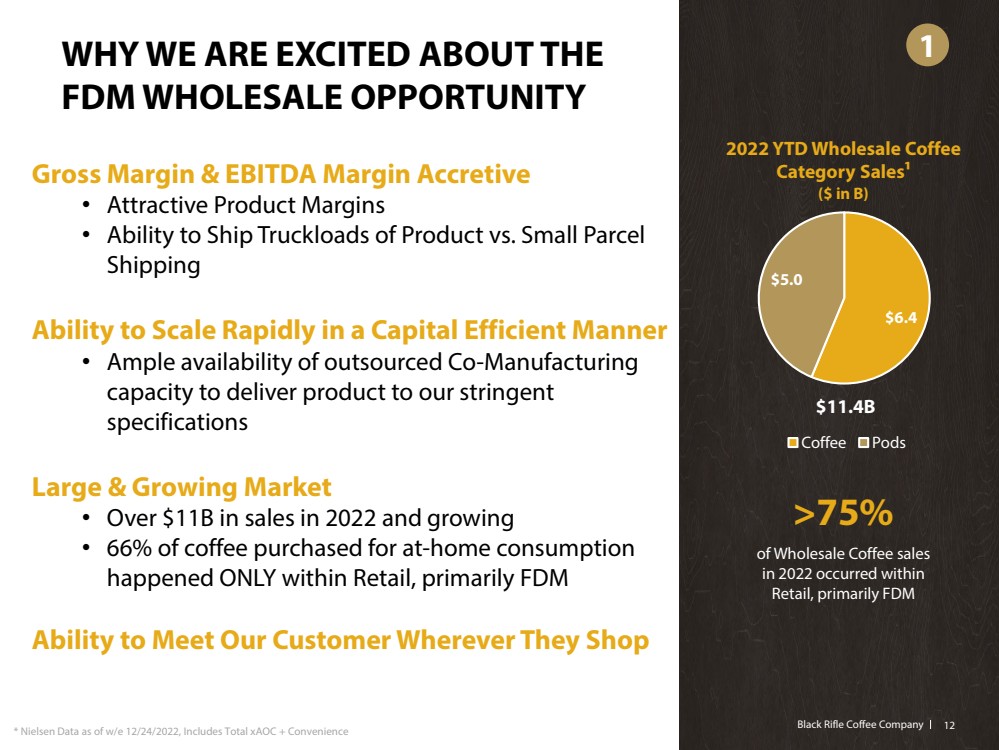
| Black Rifle Coffee Company Black Rifle Coffee Company WHY WE ARE EXCITED ABOUT THE FDM WHOLESALE OPPORTUNITY $6.4$5.0 Coffee Pods122022 YTD Wholesale Coffee Category Sales¹($ in B)* Nielsen Data as of w/e 12/24/2022, Includes Total xAOC+ Convenience>75%of Wholesale Coffee sales in 2022 occurred within Retail, primarily FDMGross Margin & EBITDA Margin Accretive•Attractive Product Margins•Ability to Ship Truckloads of Product vs. Small Parcel ShippingAbility to Scale Rapidly in a Capital Efficient Manner•Ample availability of outsourced Co-Manufacturing capacity to deliver product to our stringent specificationsLarge & Growing Market •Over $11B in sales in 2022 and growing•66% of coffee purchased for at-home consumption happened ONLY within Retail, primarily FDMAbility to Meet Our Customer Wherever They Shop$11.4B 1 |
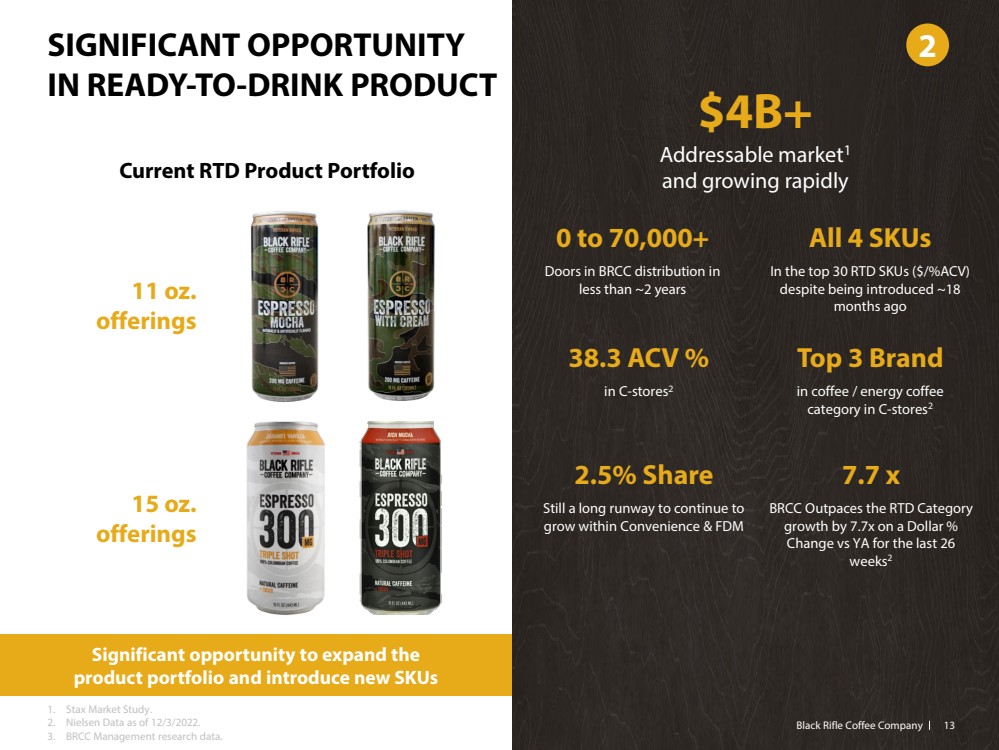
| SIGNIFICANT OPPORTUNITY IN READY-TO-DRINK PRODUCT Black Rifle Coffee Company13 2Current RTD Product Portfolio 11 oz. offerings15 oz. offerings Significant opportunity to expand the product portfolio and introduce new SKUs1.StaxMarket Study.2.Nielsen Data as of 12/3/2022.3.BRCC Management research data.$4B+Addressable market1 and growing rapidly 0 to 70,000+Doors in BRCC distribution in less than ~2 yearsAll 4 SKUsIn the top 30 RTD SKUs ($/%ACV) despite being introduced ~18 months agoTop 3 Brandin coffee / energy coffee category in C-stores238.3 ACV %in C-stores27.7 xBRCC Outpaces the RTD Category growth by 7.7x on a Dollar % Change vs YA for the last 26 weeks22.5% ShareStill a long runway to continue to grow within Convenience & FDM |
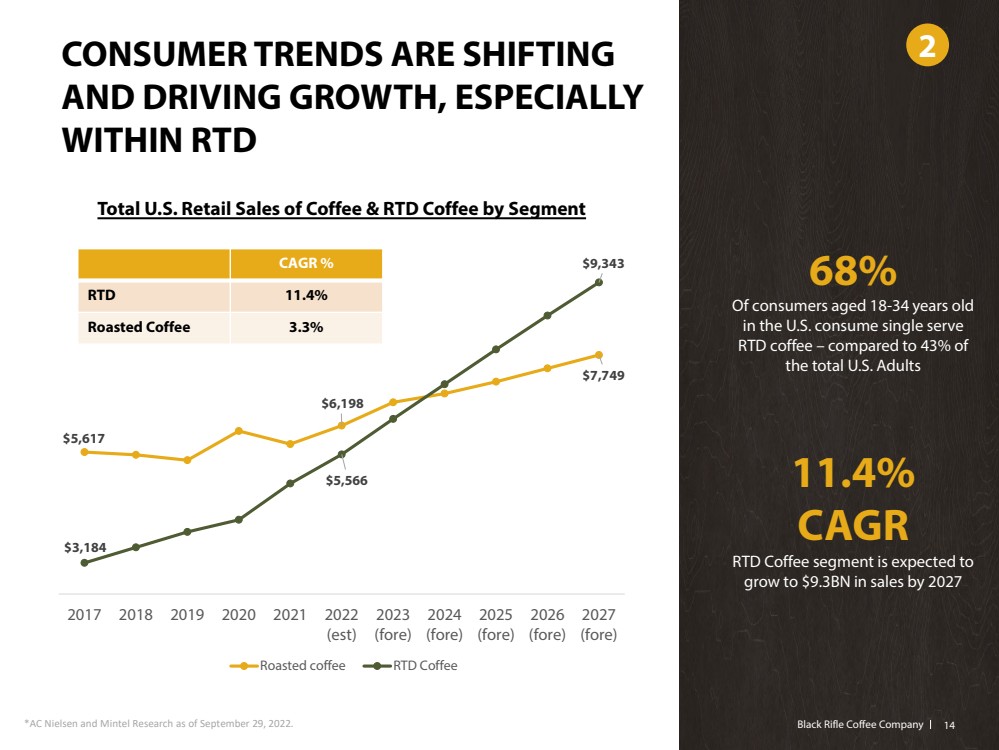
| Black Rifle Coffee Company Black Rifle Coffee Company CONSUMER TRENDS ARE SHIFTING AND DRIVING GROWTH, ESPECIALLY WITHIN RTDTotal U.S. Retail Sales of Coffee & RTD Coffee by Segment *AC Nielsen and Mintel Research as of September 29, 2022.68%Of consumers aged 18-34 years old in the U.S. consume single serve RTD coffee –compared to 43% of the total U.S. Adults11.4% CAGRRTD Coffee segment is expected to grow to $9.3BN in sales by 2027 $5,617 $6,198 $7,749 $3,184 $5,566 $9,343 201720182019202020212022(est)2023(fore)2024(fore)2025(fore)2026(fore)2027(fore) Roasted coffee RTD Coffee14 2 CAGR %RTD11.4%Roasted Coffee3.3% |
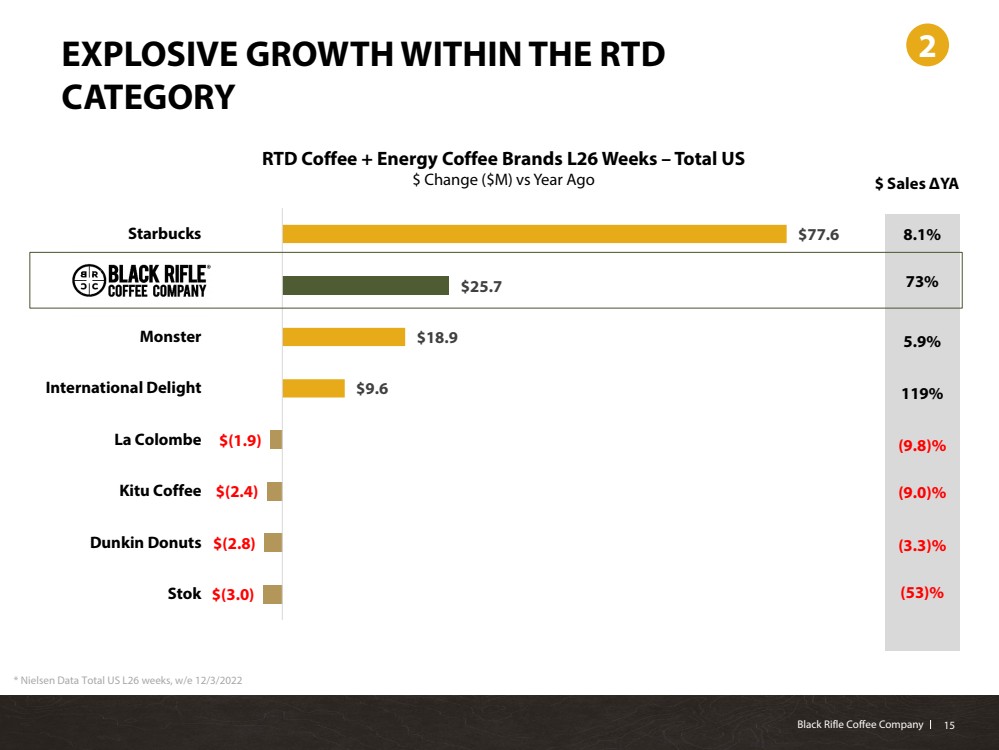
| Black Rifle Coffee Company Black Rifle Coffee Company EXPLOSIVE GROWTH WITHIN THE RTD CATEGORY $(3.0)$(2.8)$(2.4)$(1.9)$9.6 $18.9 $25.7 $77.6 StokDunkin DonutsKitu CoffeeLa ColombeInternational DelightMonsterBlack Rifle CoffeeStarbucksRTD Coffee + Energy Coffee Brands L26 Weeks –Total US$ Change ($M) vs Year Ago$ Sales ΔYA8.1%73%5.9%119%(9.8)%(9.0)%(3.3)%(53)% * Nielsen Data Total US L26 weeks, w/e 12/3/202215 2 |
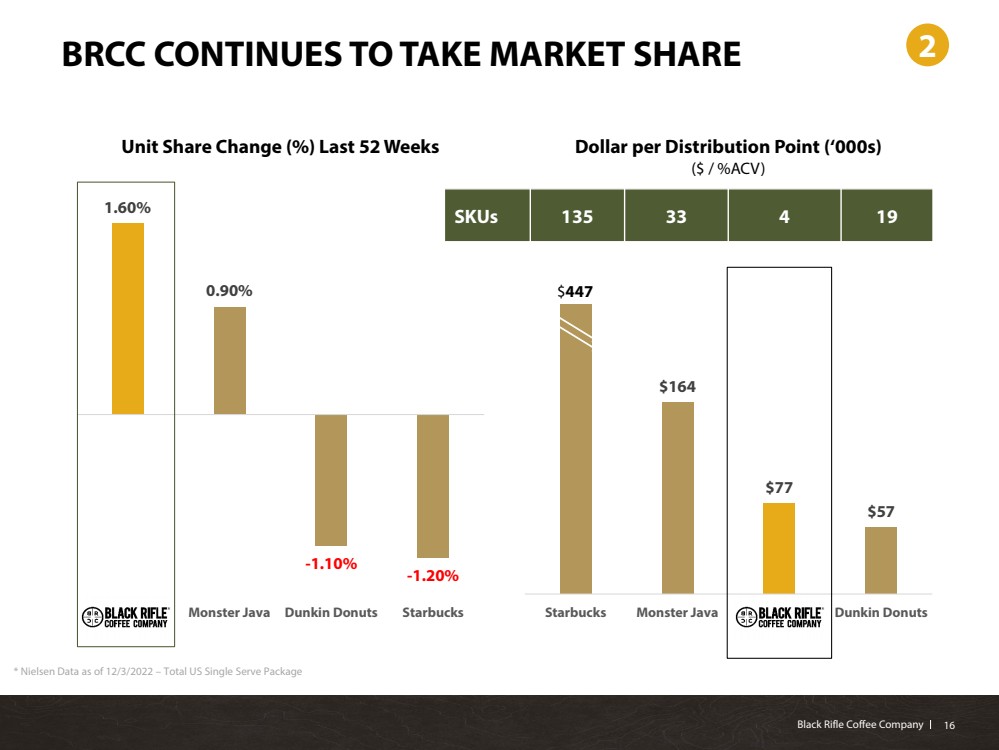
| Black Rifle Coffee Company Black Rifle Coffee Company BRCC CONTINUES TO TAKE MARKET SHARE 1.60%0.90%-1.10%-1.20%Black RifleCoffeeMonster JavaDunkin DonutsStarbucksUnit Share Change (%) Last 52 Weeks * Nielsen Data as of 12/3/2022 –Total US Single Serve Package $164$77$57StarbucksMonster JavaBlack RifleCoffeeDunkin DonutsDollar per Distribution Point (‘000s)($ / %ACV) $ 447 216 SKUs13533419 |
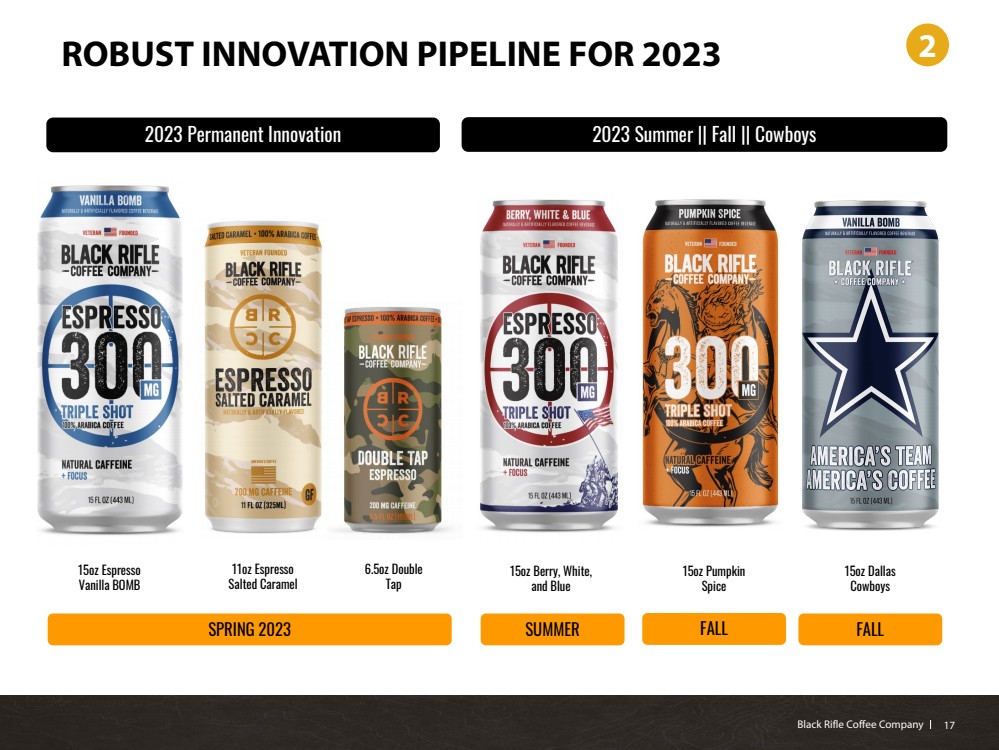
| Black Rifle Coffee Company Black Rifle Coffee Company ROBUST INNOVATION PIPELINE FOR 2023 2 15oz Espresso Vanilla BOMB11oz Espresso Salted Caramel6.5oz Double Tap 2023 Permanent Innovation 15oz Berry, White, and Blue15oz Pumpkin Spice 2023 Summer || Fall || Cowboys SPRING 2023 SUMMER FALL FALL 15oz Dallas Cowboys17 |
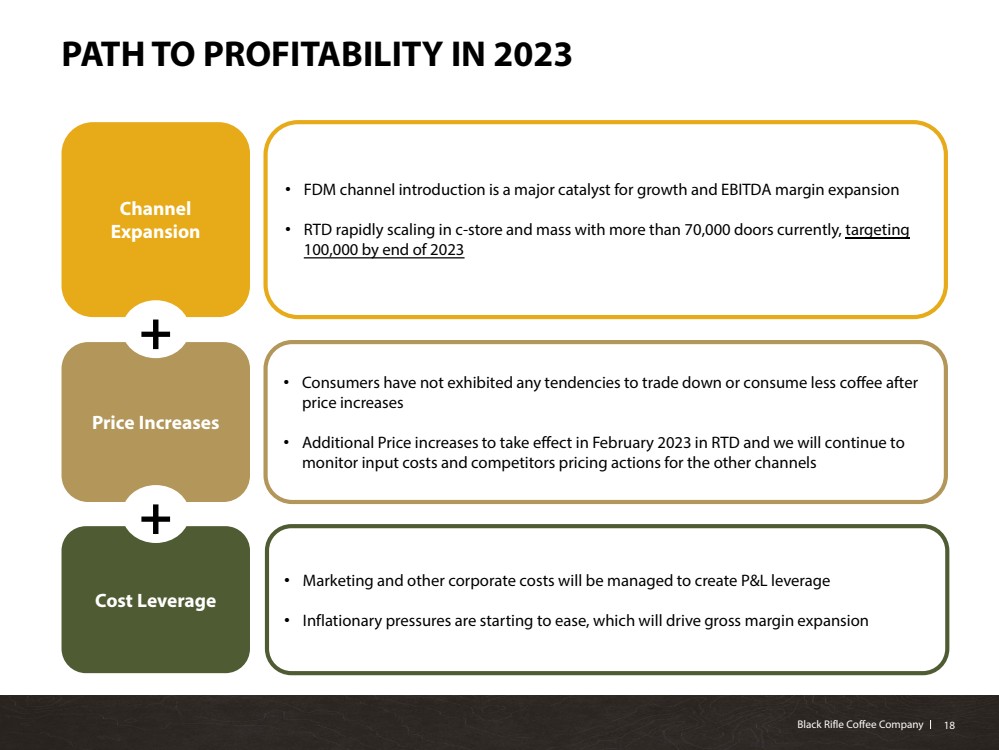
| Black Rifle Coffee Company Black Rifle Coffee Company PATH TO PROFITABILITY IN 2023 Price Increases •Consumers have not exhibited any tendencies to trade down or consume less coffee after price increases•Additional Price increases to take effect in February 2023 in RTD and we will continue to monitor input costs and competitors pricing actions for the other channels •FDM channel introduction is a major catalyst for growth and EBITDA margin expansion •RTD rapidly scaling in c-store and mass with more than 70,000 doors currently, targeting 100,000 by end of 2023 ChannelExpansion •Marketing and other corporate costs will be managed to create P&L leverage•Inflationary pressures are starting to ease, which will drive gross margin expansion Cost Leverage + +18 |
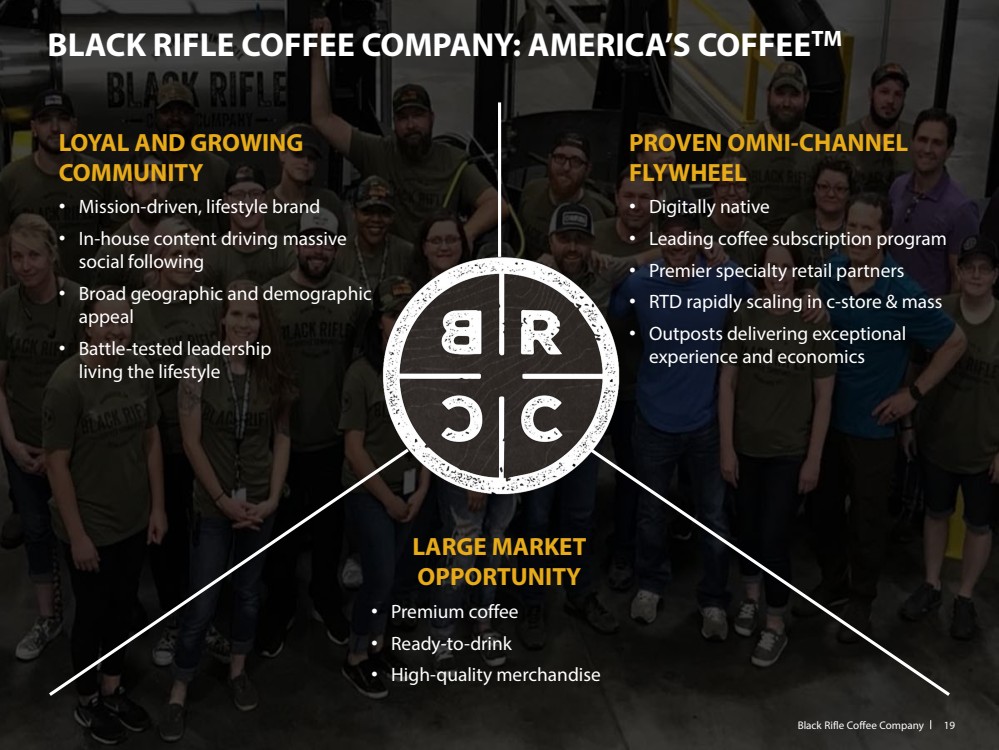
| BLACK RIFLE COFFEE COMPANY: AMERICA’S COFFEETM Black Rifle Coffee Company19 LOYAL AND GROWING COMMUNITY•Mission-driven, lifestyle brand•In-house content driving massive social following •Broad geographic and demographic appeal•Battle-tested leadershipliving the lifestylePROVEN OMNI-CHANNEL FLYWHEEL•Digitally native•Leading coffee subscription program•Premier specialty retail partners•RTD rapidly scaling in c-store & mass•Outposts delivering exceptional experience and economicsLARGE MARKET OPPORTUNITY•Premium coffee•Ready-to-drink•High-quality merchandise |