Exhibit 99.1
March 2025 Introduction to Black Rifle Coffee Company
ENERGY LIFESTYLE COMMUNITY
1 DISCLAIMER Disclaimer This presentation is for informational purposes only.
The information contained herein does not purport to be all-inclusive and none of BRC Inc. (“the Company”, “we”, “us” and “our”) or its respective affiliates makes any representation or warranty, express or implied, as to the accuracy,
completeness or reliability of the information contained in this presentation. The Company has not verified, and will not verify, any part of this presentation. The recipient should make its own independent investigations and analyses of the
Company and its own assessment of all information and material provided, or made available, by the Company or any of its respective directors, officers, employees, affiliates, agents, advisors or representatives. This presentation does not
constitute a solicitation of a proxy, consent or authorization with respect to any securities. This presentation shall also not constitute an offer to sell, a solicitation of an offer to buy, or a recommendation to purchase any securities.
You should consult your own counsel and tax and financial advisors as to legal and related matters concerning the matters described herein, and, by accepting this presentation, you confirm that you are not relying upon the information
contained herein to make any decision. Forward-Looking Statements This presentation contains forward-looking statements about the Company and its industry that involve substantial risks and uncertainties. All statements other than
statements of historical fact contained in this presentation, including statements regarding the Company’s intentions, beliefs or current expectations concerning the Company’s financial condition, liquidity, prospects, growth, strategies,
future market conditions, developments in the capital and credit markets and expected future financial performance, as well as any information concerning possible or assumed future results of operations, are forward-looking statements. In
some cases, you can identify forward-looking statements because they contain words such as “anticipate,” “believe,” “continue,” “could,” “estimate,” “expect,” “intends,” “may,” “might,” “plan,” “possible,” “potential,” “predict,” “project,”
“should,” “will,” “would” and similar expressions, but the absence of these words does not mean that a statement is not forward-looking. The events and circumstances reflected in the Company’s forward-looking statements may not be achieved or
occur and actual results could differ materially from those projected in the forward-looking statements. Factors that may cause such forward-looking statements to differ from actual results include, but are not limited to: competition and our
ability to grow, manage sustainable expansion, and retain key employees; failure to compete effectively with other producers, distributors and retailers of coffee and energy drinks; our limited operating history, which may hinder the
successful execution of strategic initiatives and make it difficult to assess future risks and challenges; challenges in managing rapid growth, inventory needs, and relationships with key business partners; inability to raise additional
capital necessary for business development; failure to achieve or sustain long-term profitability; inability to effectively manage debt obligations; failure to maximize the value of assets received through bartering transactions; negative
publicity affecting our brand, reputation, or that of key employees; failure to uphold our position as a supportive member of the Veteran and military communities, or other factors negatively affecting brand perception; inability to establish
and maintain strong brand recognition through intellectual property or other means; shifts in consumer spending, lack of interest in new products or changes in brand perception upon evolving consumer preferences and tastes; unsuccessful
marketing campaigns that incur costs without attracting new customers or realizing higher revenue; failure to attract new customers or retain existing customers; risks associated with reliance on social media platforms, including dependence
on third-party platforms for marketing and engagement; declining performance of the direct to consumer revenue channel; inability to effectively manage or scale distribution through Wholesale business partners, particularly key Wholesale
partners; failure to manage supply chain operations effectively, including inaccurate forecasting of raw material and co-manufacturing requirements; loss of one or more co-manufacturers or production delays, quality issues, or labor-related
disruptions affecting manufacturing output; supply chain disruptions or failures by third-party suppliers to deliver coffee, store supplies, RTD beverage ingredients, or merchandise, including disruptions caused by external factors; ongoing
risks related to supply chain volatility and reliability, including political and climate risks; fluctuations in the market for high-quality coffee beans and other key commodities; unpredictable changes in the cost and availability of real
estate, labor, raw materials, equipment, transportation, or shipping; failure to successfully open new Black Rifle Coffee shops, including permitting delays, development challenges, or underperformance of existing locations; risks related to
long-term, non-cancelable lease obligations and other real estate-related concerns; inability of franchise partners to successfully operate and manage their franchise locations; failure to maintain high-quality customer experiences for retail
partners and end users, including production defects or issues caused by co-manufacturers that negatively impact product quality and brand reputation; failure to comply with food safety regulations or maintain product quality standards;
difficulties in successfully expanding into new domestic and international markets; failure to comply with federal, state, and local laws and regulations, or inability to prevail in civil litigation matters; risks related to potential
unionization of employees; failure to protect against cybersecurity threats, software vulnerabilities, or hardware security risks; and other risks and uncertainties indicated in our Annual Report on Form 10-K for the year ended December 31,
2024 filed with the Securities and Exchange Commission (the “SEC”) on March 3, 2025 including those set forth under “Item 1A. Risk Factors” included therein, as well as in our other filings with the SEC. Such forward-looking statements are
based on information available as of the date of this presentation and the Company’s current beliefs and expectations concerning future developments and their effects on the Company. Because forward-looking statements are inherently subject
to risks and uncertainties, some of which cannot be predicted or quantified, you should not place undue reliance on these forward-looking statements as predictions of future events. Although the Company believes that it has a reasonable basis
for each forward-looking statement contained in this presentation, the Company cannot guarantee that the future results, growth, performance or events or circumstances reflected in these forward-looking statements will be achieved or occur at
all. These forward-looking statement speak only as of the date of this presentation. The Company does not undertake any obligation to update or revise any forward-looking statements, whether as a result of new information, future events or
otherwise, except as may be required under applicable securities laws.
2 DISCLAIMER Non-GAAP Financial Measures This presentation includes
projections of certain financial measures not presented in accordance with generally accepted accounting principles (“GAAP”) including, but not limited to, EBITDA, Adjusted EBITDA, Adjusted Gross Margin, and Adjusted EBITDA Margin. These non
-GAAP financial measures are not measures of financial performance in accordance with GAAP and may exclude items that are significant in understanding and assessing the Company’s financial results. Accordingly, the non-GAAP financial measures
we use and refer to should not be viewed as a substitute for performance measures derived in accordance with GAAP or as a substitute for a measure of liquidity. Our definitions of EBITDA and Adjusted EBITDA described below are specific to our
business and you should not assume that they are comparable to similarly titled financial measures of other companies. We define EBITDA as net income (loss) before interest, tax expense, depreciation and amortization expense. We define
Adjusted EBITDA, as adjusted for equity-based compensation, system implementation costs, executive recruiting and severance, write-off of site development costs, strategic initiative related costs, non-routine legal expenses, RTD start-up
production issues, (gain) loss on assets held for sale, contract termination costs, restructuring fees and related costs, RTD transformation costs, and loss on impairment of assets. When used in conjunction with GAAP financial measures, we
believe that EBITDA and Adjusted EBITDA are useful supplemental measures of operating performance and liquidity because these measures facilitate comparisons of historical performance by excluding non-cash items such as equity-based
compensation and other amounts not directly attributable to our primary operations, such as system implementation costs, write-off of site development costs, non-routing legal expense, restructuring fees and related costs, RTD transformation
costs and loss on impairment of assets. Adjusted EBITDA is also a key metric used internally by our management to evaluate performance and develop internal budgets and forecasts. EBITDA and Adjusted EBITDA have limitations as an analytical
tool and should not be considered in isolation or as a substitute for analyzing our results as reported under GAAP and may not provide a complete understanding of our operating results as a whole. Some of these limitations are (i) they do not
reflect changes in, or cash requirements for, our working capital needs, (ii) they do not reflect our interest expense or the cash requirements necessary to service interest or principal payments on our debt, (iii) they do not reflect our tax
expense or the cash requirements to pay our taxes, (iv) they do not reflect historical capital expenditures or future requirements for capital expenditures or contractual commitments, (v) although equity-based compensation expenses are
non-cash charges, we rely on equity compensation to compensate and incentivize employees, directors and certain consultants, and we may continue to do so in the future and (vi) although depreciation, amortization and impairments are non-cash
charges, the assets being depreciated and amortized will often have to be replaced in the future, and these non-GAAP measures do not reflect any cash requirements for such replacements. We have not reconciled forward-looking Adjusted EBITDA
to its most directly comparable GAAP measure, net income (loss), in reliance on the unreasonable efforts exception provided under Item 10(e)(1)(i)(B) of Regulation S-K. We cannot predict with reasonable certainty the ultimate outcome of
certain components of such reconciliation, including market-related assumptions that are not within our control, or others that may arise, without unreasonable effort. For these reasons, we are unable to assess the probable significance of
the unavailable information, which could materially impact the amount of future net income (loss). Use of Projections This presentation contains financial forecasts with respect to the Company’s projected financial results, including
Revenue, Gross Margin and Adjusted EBITDA, for the Company’s fiscal years through 2027. The Company’s independent auditors have not audited, reviewed, compiled or performed any procedures with respect to the projections for the purpose of
their inclusion in this presentation, and accordingly, they did not express an opinion or provide any other form of assurance with respect thereto for the purpose of this presentation. These projections should not be relied upon as being
necessarily indicative of future results. The assumptions and estimates underlying the prospective financial information are inherently uncertain and are subject to a wide variety of significant business, economic and competitive risks and
uncertainties that could cause actual results to differ materially from those contained in the prospective financial information. Accordingly, there can be no assurance that the prospective results are indicative of the future performance of
the Company or that actual results will not differ materially from those presented in the prospective financial information. Inclusion of the prospective financial information in this presentation should not be regarded as a representation by
any person that the results contained in the prospective financial information will be achieved. Industry and Market Data This presentation also contains estimates and other statistical data made by independent parties and by the Company
relating to market size and growth and other data about the Company’s industry. This data involves a number of assumptions and limitations, and you are cautioned not to give undue weight to such estimates. In addition, projections,
assumptions, and estimates of the future performance of the markets in which the Company operates are necessarily subject to a high degree of uncertainty and risk. Any trademarks, service marks, trade names and copyrights of the Company and
other companies contained in this presentation are the property of their respective owners.
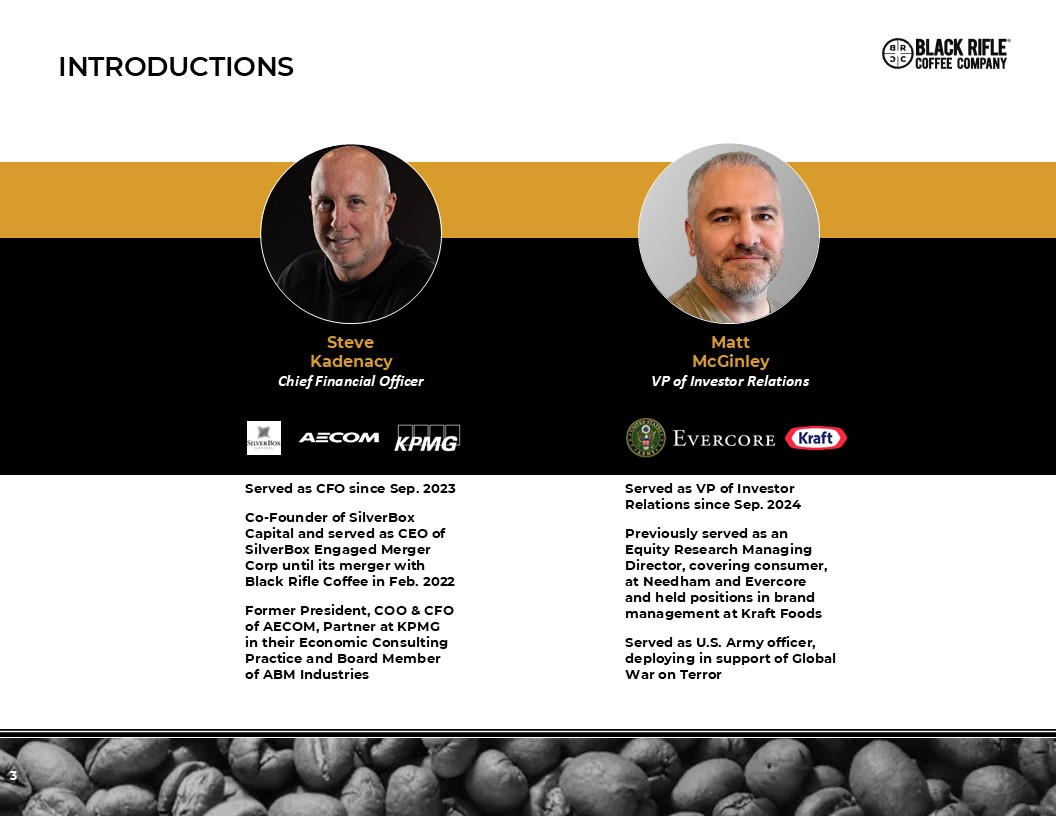
3 Introductions Served as CFO since Sep. 2023 Co-Founder of SilverBox
Capital and served as CEO of SilverBox Engaged Merger Corp until its merger with Black Rifle Coffee in Feb. 2022 Former President, COO & CFO of AECOM, Partner at KPMG in their Economic Consulting Practice and Board Member of ABM
Industries Steve Kadenacy Chief Financial Officer Served as VP of Investor Relations since Sep. 2024 Previously served as an Equity Research Managing Director, covering consumer, at Needham and Evercore and held positions in brand
management at Kraft Foods Served as U.S. Army officer, deploying in support of Global War on Terror Matt McGinley VP of Investor Relations
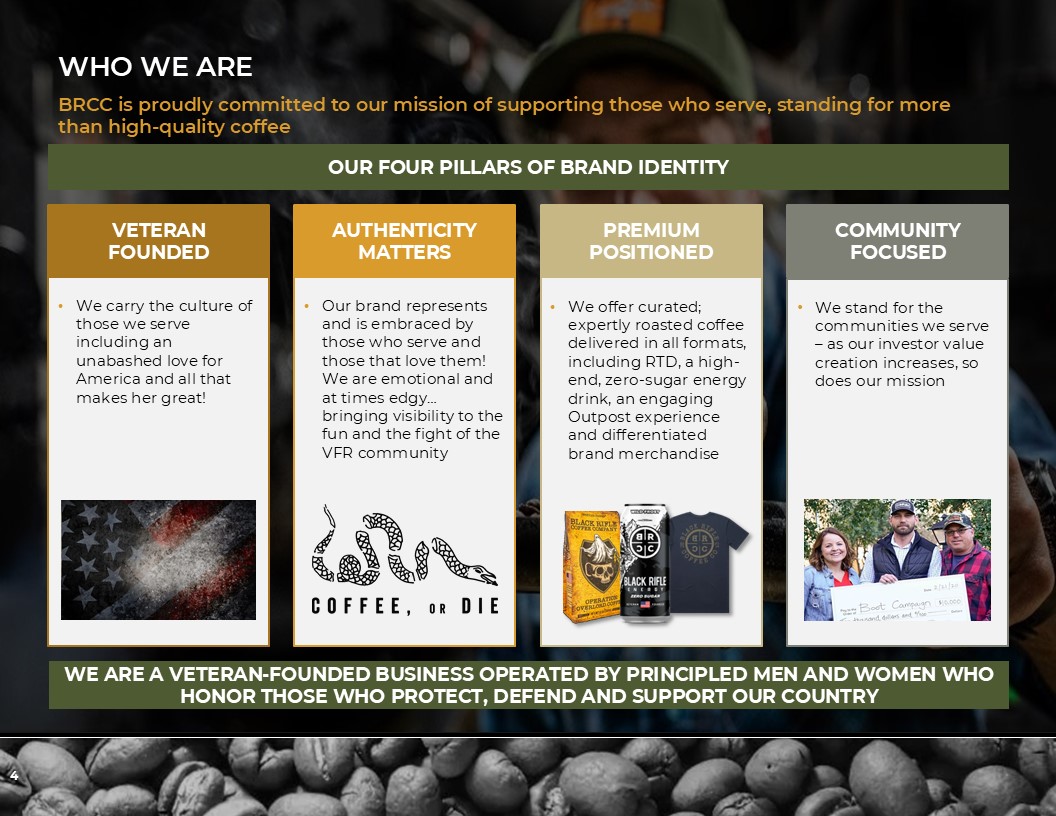
COMMUNITY FOCUSED We stand for the communities we serve – as our investor value
creation increases, so does our mission PREMIUM POSITIONED We offer curated; expertly roasted coffee delivered in all formats, including RTD, a high-end, zero-sugar energy drink, an engaging Outpost experience and differentiated brand
merchandise AUTHENTICITY MATTERS Our brand represents and is embraced by those who serve and those that love them! We are emotional and at times edgy… bringing visibility to the fun and the fight of the VFR community VETERAN FOUNDED We
carry the culture of those we serve including an unabashed love for America and all that makes her great! 4 BRCC is proudly committed to our mission of supporting those who serve, standing for more than high-quality coffee Who WE ARE WE
ARE A VETERAN-FOUNDED BUSINESS OPERATED BY PRINCIPLED MEN AND WOMEN WHO HONOR THOSE WHO PROTECT, DEFEND AND SUPPORT OUR COUNTRY OUR FOUR PILLARS OF BRAND IDENTITY
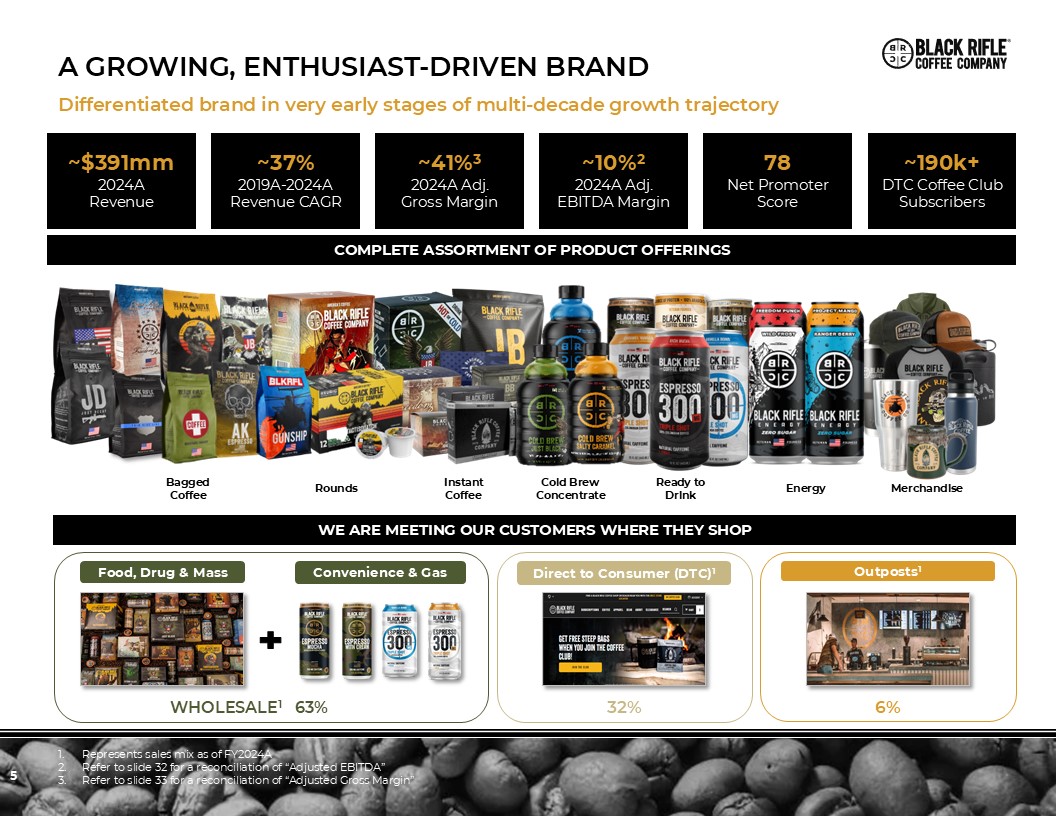
5 A growing, enthusiast-driven brand Cold Brew Concentrate COMPLETE
ASSORTMENT OF PRODUCT OFFERINGS WE ARE MEETING OUR CUSTOMERS WHERE THEY SHOP Convenience & Gas Food, Drug & Mass WHOLESALE1 63% Represents sales mix as of FY2024A Refer to slide 32 for a reconciliation of “Adjusted
EBITDA” Refer to slide 33 for a reconciliation of “Adjusted Gross Margin” Energy Direct to Consumer (DTC)1 Outposts1 32% 6% Differentiated brand in very early stages of multi-decade growth trajectory Ready to
Drink Bagged Coffee Rounds Instant Coffee Merchandise ~$391mm2024A Revenue ~41%32024A Adj.Gross Margin ~10%22024A Adj. EBITDA Margin 78Net Promoter Score ~190k+DTC Coffee Club Subscribers ~37%2019A-2024A Revenue CAGR
6 OUR SIGHTS ARE TRAINED ON THE MOST ATTRACTIVE SEGMENTS OF THE BEVERAGE
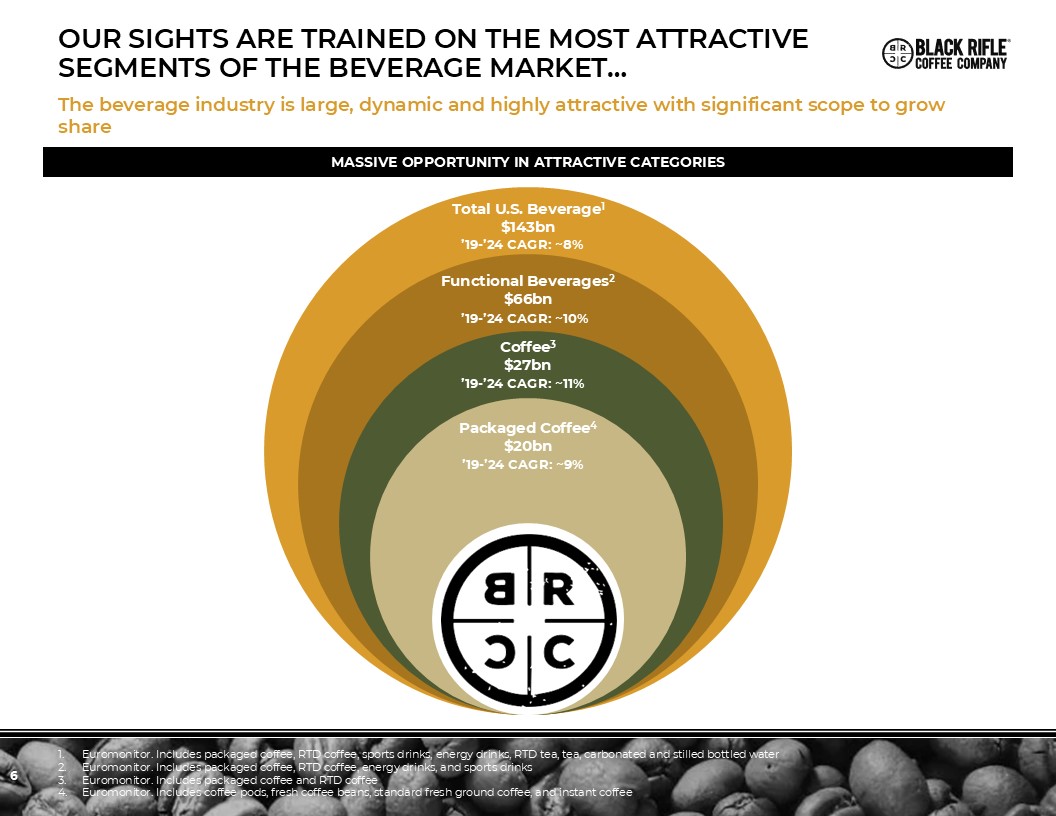
MARKET… MASSIVE OPPORTUNITY IN ATTRACTIVE CATEGORIES Euromonitor. Includes packaged coffee, RTD coffee, sports drinks, energy drinks, RTD tea, tea, carbonated and stilled bottled water Euromonitor. Includes packaged coffee, RTD coffee,
energy drinks, and sports drinks Euromonitor. Includes packaged coffee and RTD coffee Euromonitor. Includes coffee pods, fresh coffee beans, standard fresh ground coffee, and instant coffee The beverage industry is large, dynamic and
highly attractive with significant scope to grow share Packaged Coffee4 $20bn Coffee3 $27bn Functional Beverages2 $66bn Total U.S. Beverage1 $143bn ’19-’24 CAGR: ~9% ’19-’24 CAGR: ~11% ’19-’24 CAGR: ~10% ’19-’24 CAGR: ~8%
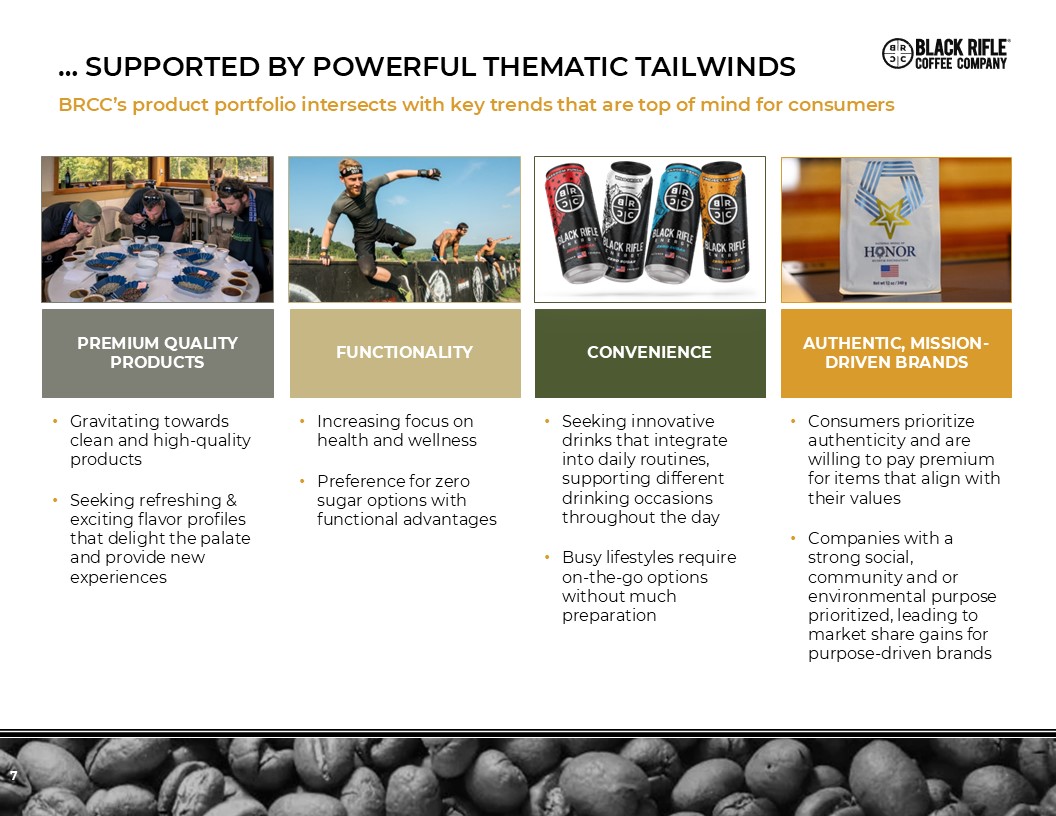
7 … supported by powerful thematic tailwinds Gravitating towards clean and
high-quality products Seeking refreshing & exciting flavor profiles that delight the palate and provide new experiences Increasing focus on health and wellness Preference for zero sugar options with functional advantages Seeking
innovative drinks that integrate into daily routines, supporting different drinking occasions throughout the day Busy lifestyles require on-the-go options without much preparation Consumers prioritize authenticity and are willing to pay
premium for items that align with their values Companies with a strong social, community and or environmental purpose prioritized, leading to market share gains for purpose-driven brands FUNCTIONALITY CONVENIENCE AUTHENTIC,
MISSION-DRIVEN BRANDS PREMIUM QUALITY PRODUCTS BRCC’s product portfolio intersects with key trends that are top of mind for consumers
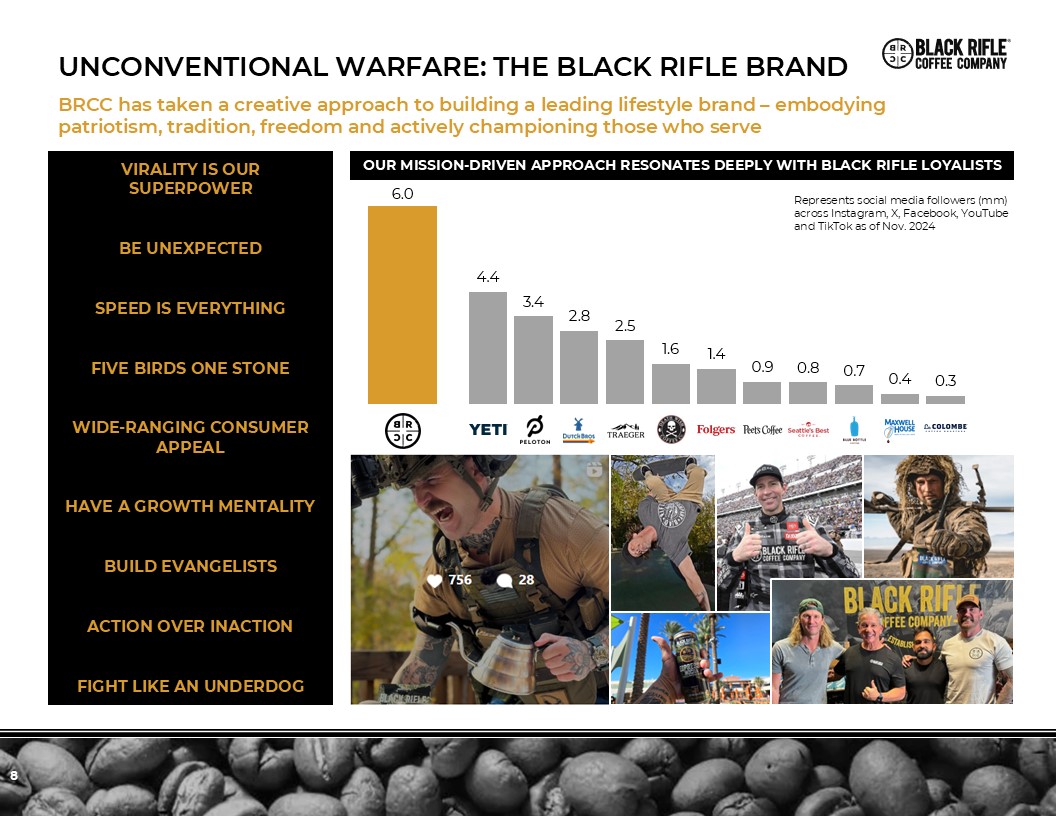
8 Unconventional Warfare: The black rifle brand VIRALITY IS OUR
SUPERPOWER BE UNEXPECTED SPEED IS EVERYTHING FIVE BIRDS ONE STONE WIDE-RANGING CONSUMER APPEAL HAVE A GROWTH MENTALITY BUILD EVANGELISTS ACTION OVER INACTION FIGHT LIKE AN UNDERDOG BRCC has taken a creative approach to building a
leading lifestyle brand – embodying patriotism, tradition, freedom and actively championing those who serve Represents social media followers (mm) across Instagram, X, Facebook, YouTube and TikTok as of Nov. 2024 OUR MISSION-DRIVEN
APPROACH RESONATES DEEPLY WITH BLACK RIFLE LOYALISTS
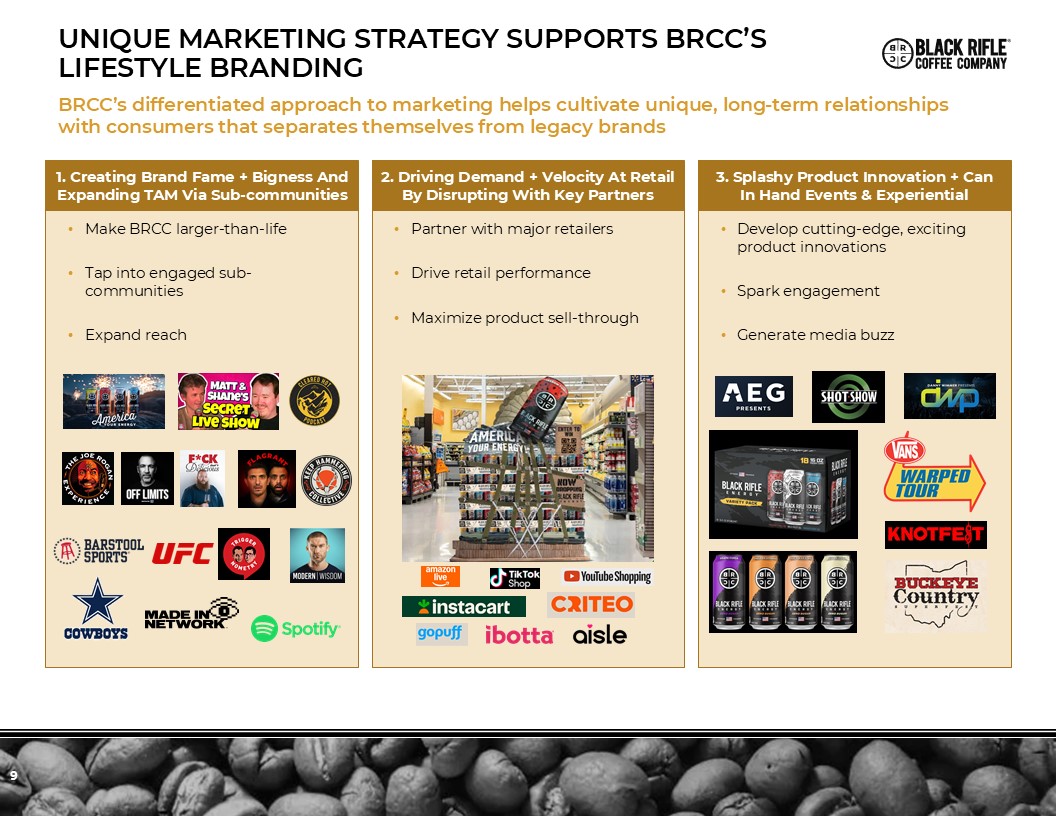
9 UNIQUE marketing strategy SUPPORTS BRCC’s LIFESTYLE BRANDING 1. Creating
Brand Fame + Bigness And Expanding TAM Via Sub-communities Make BRCC larger-than-life Tap into engaged sub-communities Expand reach 2. Driving Demand + Velocity At Retail By Disrupting With Key Partners 3. Splashy Product Innovation +
Can In Hand Events & Experiential Partner with major retailers Drive retail performance Maximize product sell-through Develop cutting-edge, exciting product innovations Spark engagement Generate media buzz BRCC’s differentiated
approach to marketing helps cultivate unique, long-term relationships with consumers that separates themselves from legacy brands
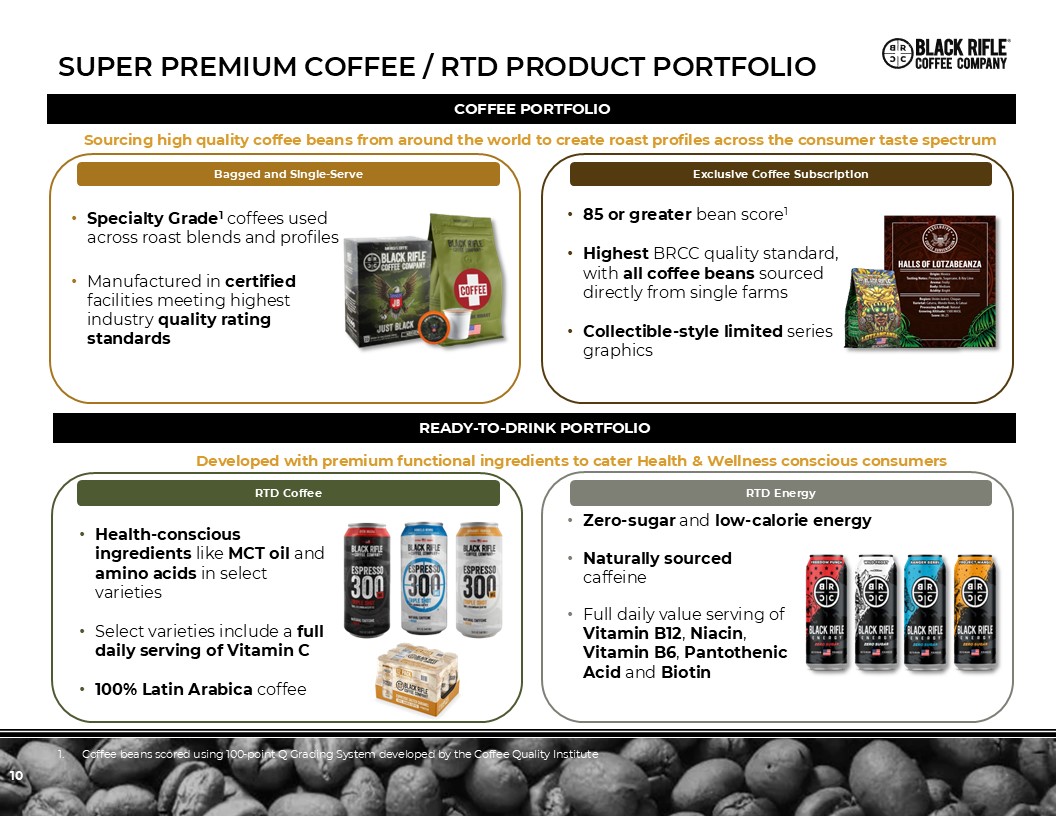
10 Super premium coffee / RTD product portfolio COFFEE
PORTFOLIO READY-TO-DRINK PORTFOLIO Coffee beans scored using 100-point Q Grading System developed by the Coffee Quality Institute Sourcing high quality coffee beans from around the world to create roast profiles across the consumer taste
spectrum Bagged and Single-Serve Exclusive Coffee Subscription RTD Energy Zero-sugar and low-calorie energy RTD Coffee Health-conscious ingredients like MCT oil and amino acids in select varieties Select varieties include a full daily
serving of Vitamin C 100% Latin Arabica coffee Developed with premium functional ingredients to cater Health & Wellness conscious consumers Specialty Grade1 coffees used across roast blends and profiles Manufactured in certified
facilities meeting highest industry quality rating standards 85 or greater bean score1 Highest BRCC quality standard, with all coffee beans sourced directly from single farms Collectible-style limited series graphics Naturally sourced
caffeine Full daily value serving of Vitamin B12, Niacin, Vitamin B6, Pantothenic Acid and Biotin
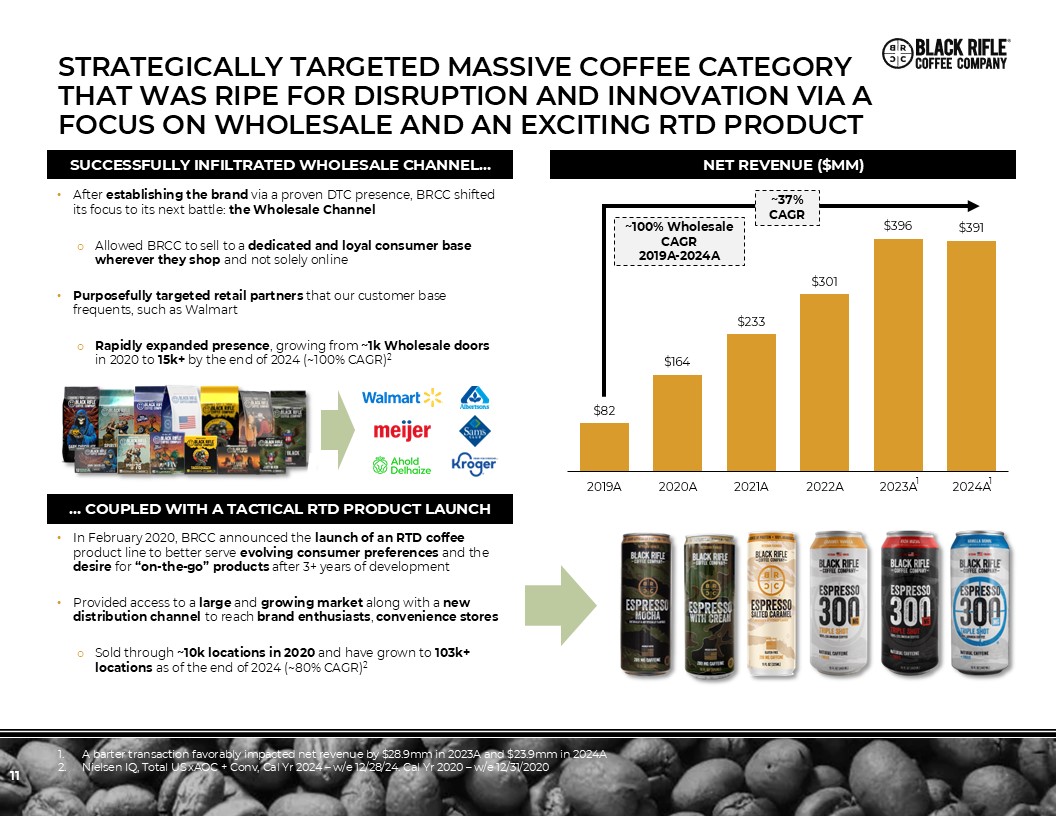
11 NET REVENUE ($MM) Strategically targeted MASSIVE COFFEE Category THAT WAS
RIPE FOR DISRUPTION and innovation via a focus on wholesale and an exciting rtd product A barter transaction favorably impacted net revenue by $28.9mm in 2023A and $23.9mm in 2024A Nielsen IQ, Total US xAOC + Conv, Cal Yr 2024 – w/e
12/28/24. Cal Yr 2020 – w/e 12/31/2020 ~100% Wholesale CAGR 2019A-2024A SUCCESSFULLY INFILTRATED WHOLESALE CHANNEL… … COUPLED WITH A TACTICAL RTD PRODUCT LAUNCH After establishing the brand via a proven DTC presence, BRCC shifted its
focus to its next battle: the Wholesale Channel Allowed BRCC to sell to a dedicated and loyal consumer base wherever they shop and not solely online Purposefully targeted retail partners that our customer base frequents, such as
Walmart Rapidly expanded presence, growing from ~1k Wholesale doors in 2020 to 15k+ by the end of 2024 (~100% CAGR)2 In February 2020, BRCC announced the launch of an RTD coffee product line to better serve evolving consumer preferences and
the desire for “on-the-go” products after 3+ years of development Provided access to a large and growing market along with a new distribution channel to reach brand enthusiasts, convenience stores Sold through ~10k locations in 2020 and
have grown to 103k+ locations as of the end of 2024 (~80% CAGR)2 1 ~37% CAGR 1
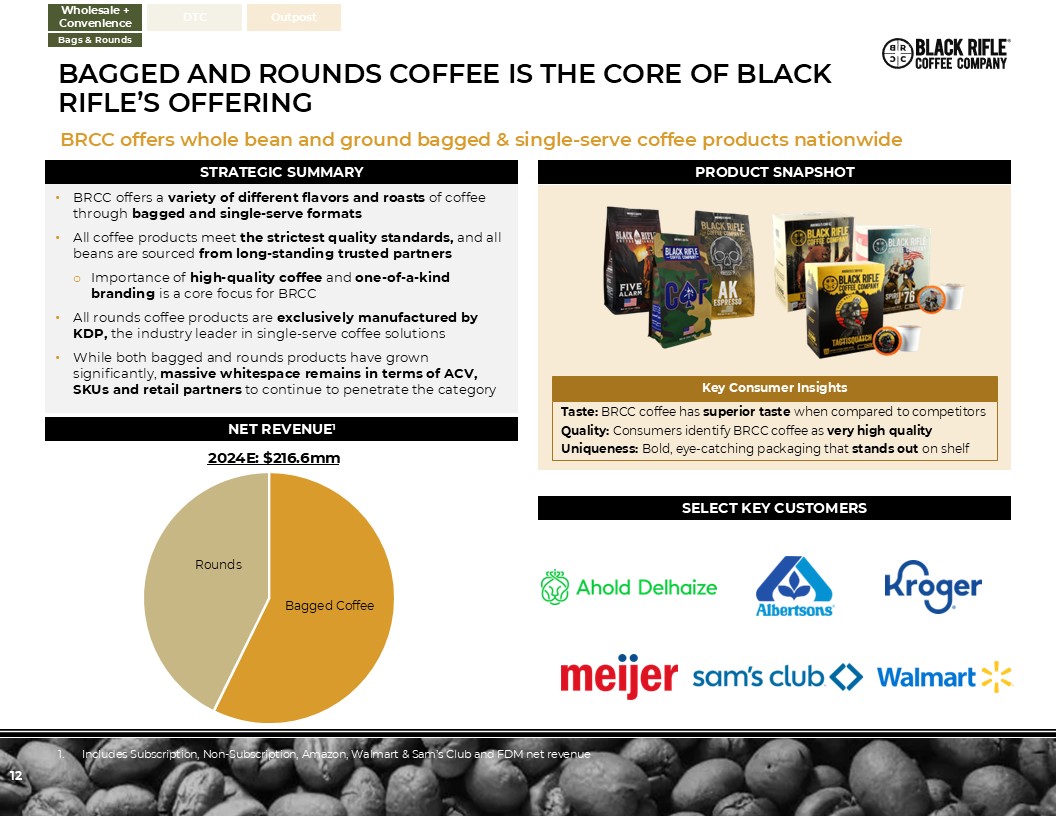
BRCC offers whole bean and ground bagged & single-serve coffee products
nationwide 12 STRATEGIC SUMMARY PRODUCT SNAPSHOT NET REVENUE1 SELECT KEY CUSTOMERS BRCC offers a variety of different flavors and roasts of coffee through bagged and single-serve formats All coffee products meet the strictest quality
standards, and all beans are sourced from long-standing trusted partners Importance of high-quality coffee and one-of-a-kind branding is a core focus for BRCC All rounds coffee products are exclusively manufactured by KDP, the industry
leader in single-serve coffee solutions While both bagged and rounds products have grown significantly, massive whitespace remains in terms of ACV, SKUs and retail partners to continue to penetrate the category Includes Subscription,
Non-Subscription, Amazon, Walmart & Sam’s Club and FDM net revenue Taste: BRCC coffee has superior taste when compared to competitors Quality: Consumers identify BRCC coffee as very high quality Uniqueness: Bold, eye-catching packaging
that stands out on shelf Key Consumer Insights Bagged Coffee Rounds 2024E: $216.6mm Bagged and rounds coffee is the core of black rifle’s offering Wholesale + Convenience DTC Outpost Bags & Rounds
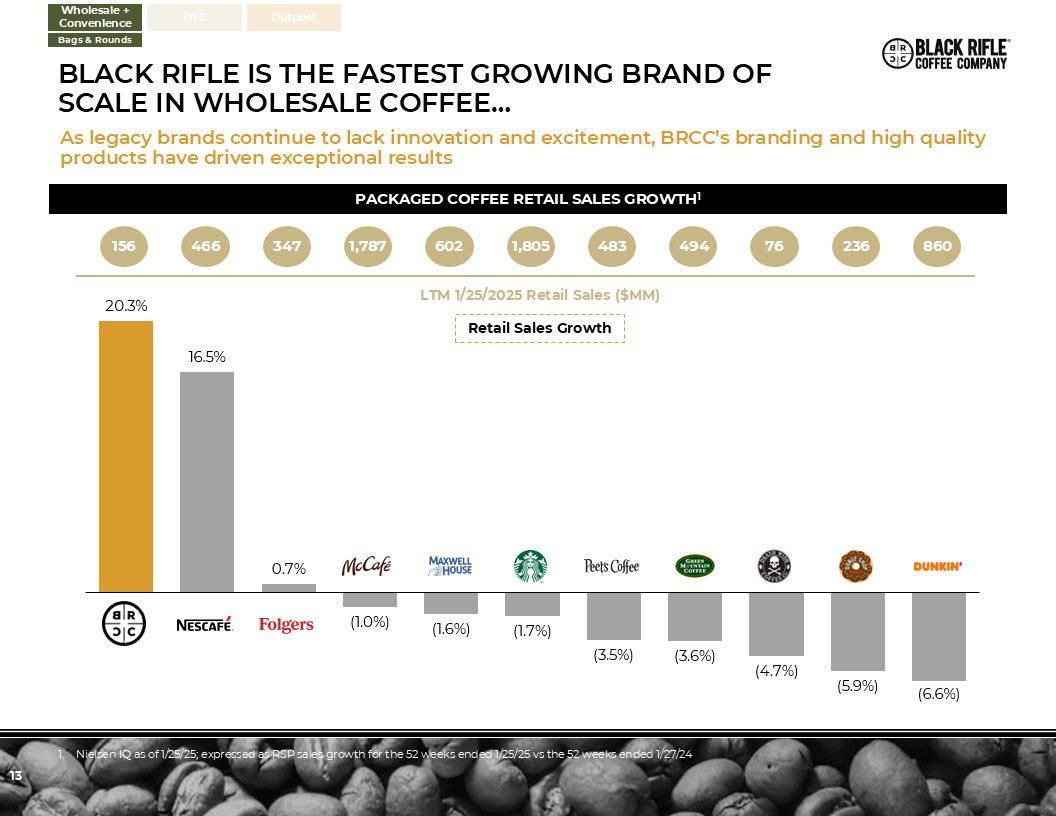
BLACK RIFLE IS THE FASTEST GROWING BRAND OF SCALE IN WHOLESALE COFFEE… 13 As
legacy brands continue to lack innovation and excitement, BRCC’s branding and high quality products have driven exceptional results PACKAGED COFFEE RETAIL SALES GROWTH1 Nielsen IQ as of 1/25/25; expressed as RSP sales growth for the 52
weeks ended 1/25/25 vs the 52 weeks ended 1/27/24 Retail Sales Growth 156 LTM 1/25/2025 Retail Sales ($MM) 466 347 76 1,787 602 483 1,805 236 494 860 Wholesale + Convenience DTC Outpost Bags & Rounds
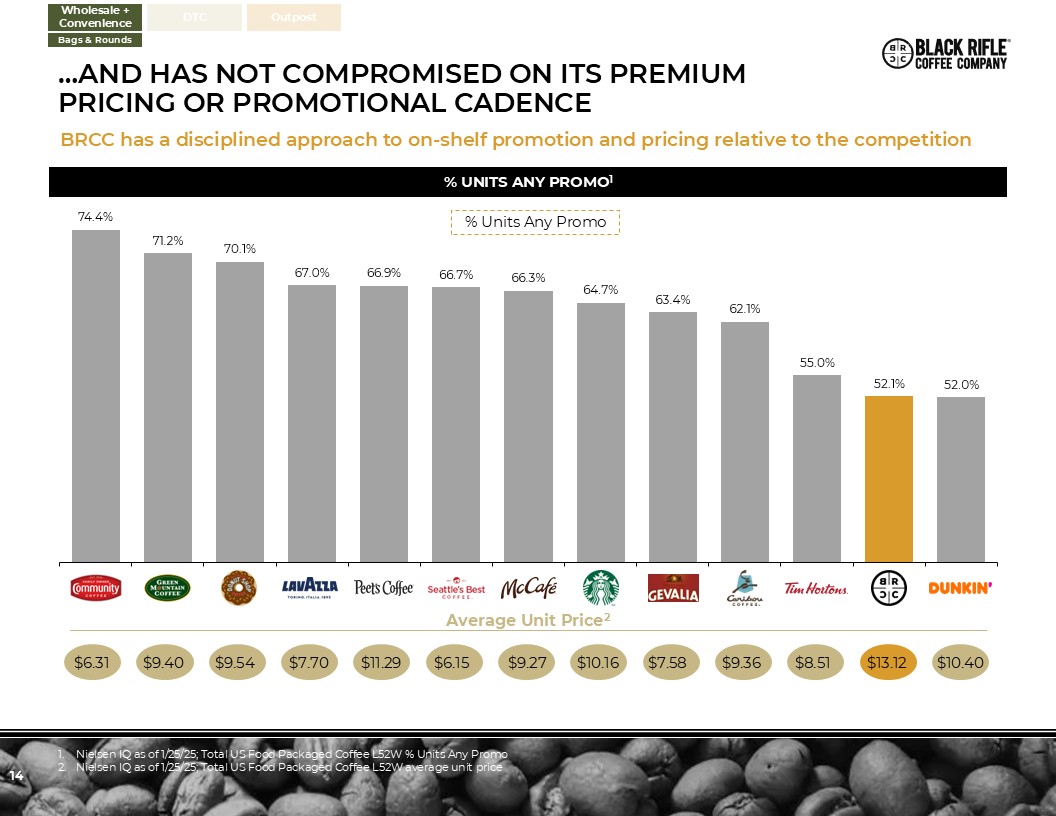
…AND HAS NOT COMPROMISED ON ITS PREMIUM PRICING OR PROMOTIONAL CADENCE 14 BRCC
has a disciplined approach to on-shelf promotion and pricing relative to the competition % UNITS ANY PROMO1 Nielsen IQ as of 1/25/25; Total US Food Packaged Coffee L52W % Units Any Promo Nielsen IQ as of 1/25/25; Total US Food Packaged
Coffee L52W average unit price % Units Any Promo Average Unit Price2 $6.31 $9.40 $9.54 $7.70 $11.29 $6.15 $9.27 $10.16 $7.58 $9.36 $8.51 $13.12 $10.40 Wholesale + Convenience DTC Outpost Bags & Rounds
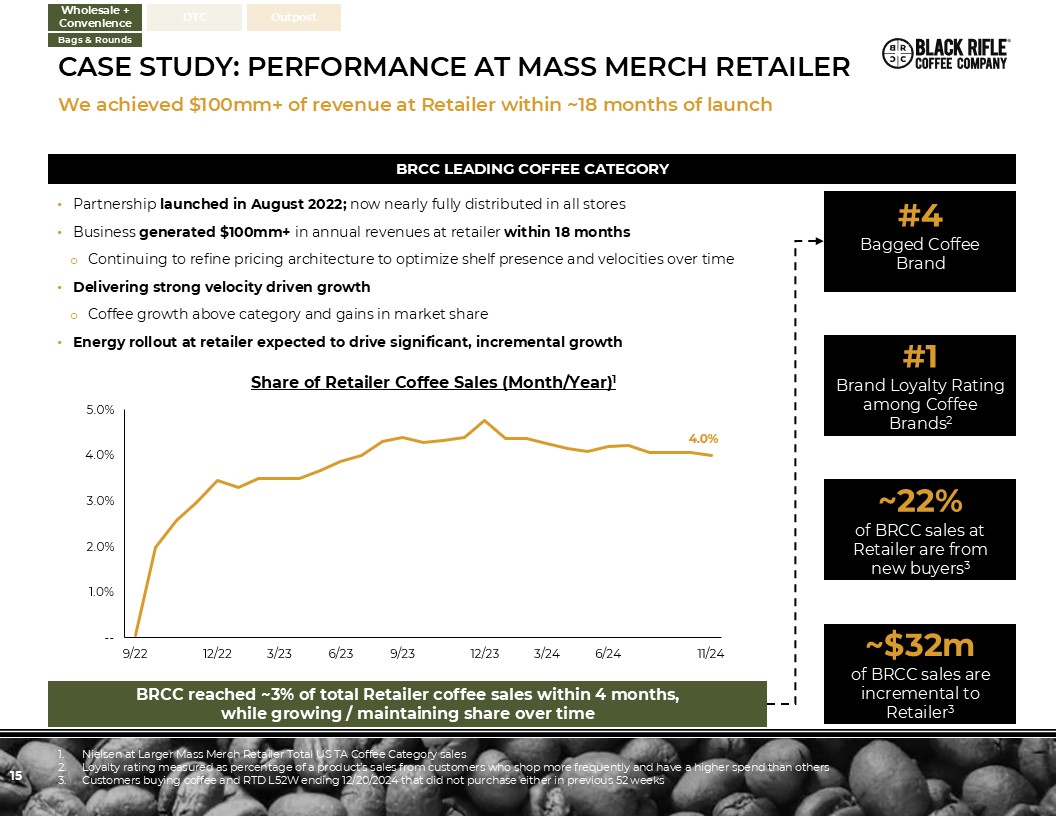
15 case study: Performance at MASS MERCH RETAILER We achieved $100mm+ of
revenue at Retailer within ~18 months of launch #4Bagged Coffee Brand ~22%of BRCC sales at Retailer are from new buyers3 ~$32mof BRCC sales are incremental to Retailer3 Partnership launched in August 2022; now nearly fully distributed in
all stores Business generated $100mm+ in annual revenues at retailer within 18 months Continuing to refine pricing architecture to optimize shelf presence and velocities over time Delivering strong velocity driven growth Coffee growth
above category and gains in market share Energy rollout at retailer expected to drive significant, incremental growth BRCC LEADING COFFEE CATEGORY Nielsen at Larger Mass Merch Retailer Total US TA Coffee Category sales Loyalty rating
measured as percentage of a product’s sales from customers who shop more frequently and have a higher spend than others Customers buying coffee and RTD L52W ending 12/20/2024 that did not purchase either in previous 52 weeks Share of
Retailer Coffee Sales (Month/Year)1 BRCC reached ~3% of total Retailer coffee sales within 4 months, while growing / maintaining share over time Wholesale + Convenience DTC Outpost Bags & Rounds #1Brand Loyalty Rating among Coffee
Brands2
1.1% -- 0.5% 1.0% 1.5% 2.0% 2.5% 3.0% 12/02/23 02/24/24 05/18/24
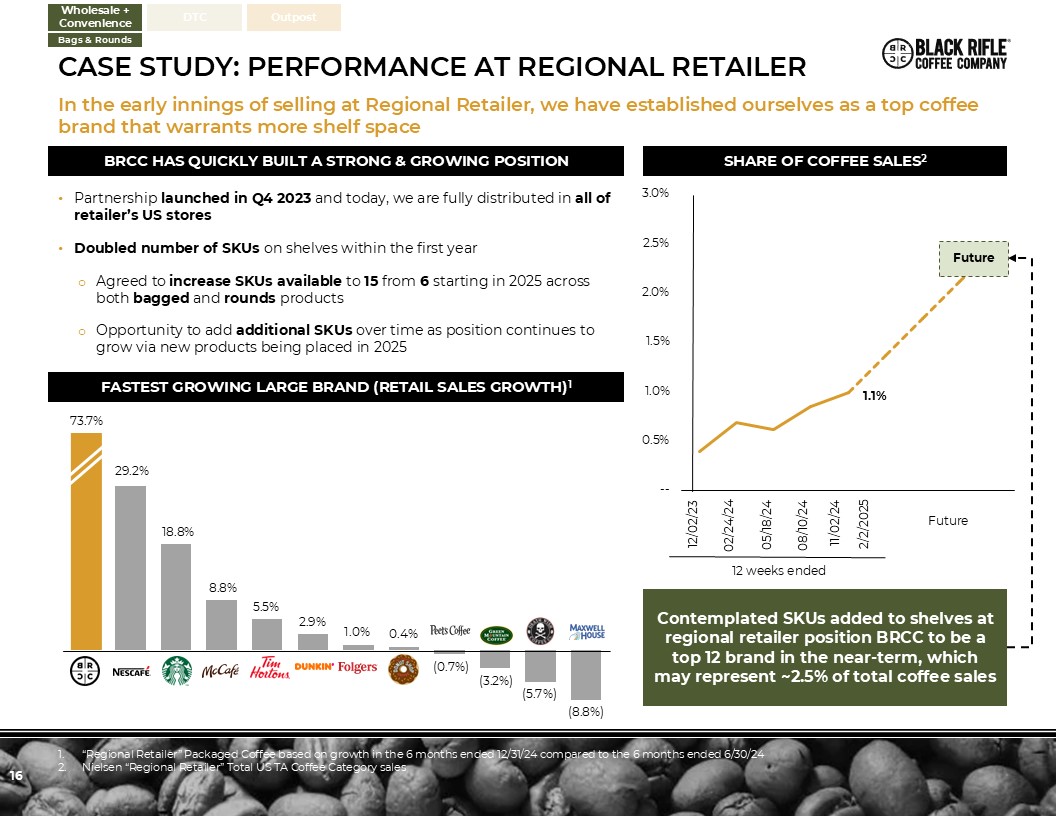
08/10/24 11/02/24 2/2/2025 16 case study: Performance at REGIONAL RETAILER In the early innings of selling at Regional Retailer, we have established ourselves as a top coffee brand that warrants more shelf space Wholesale +
Convenience DTC Outpost Bags & Rounds BRCC HAS QUICKLY BUILT A STRONG & GROWING POSITION Partnership launched in Q4 2023 and today, we are fully distributed in all of retailer’s US stores Doubled number of SKUs on shelves
within the first year Agreed to increase SKUs available to 15 from 6 starting in 2025 across both bagged and rounds products Opportunity to add additional SKUs over time as position continues to grow via new products being placed in
2025 Contemplated SKUs added to shelves at regional retailer position BRCC to be a top 12 brand in the near-term, which may represent ~2.5% of total coffee sales SHARE OF COFFEE SALES2 12 weeks ended “Regional Retailer” Packaged Coffee
based on growth in the 6 months ended 12/31/24 compared to the 6 months ended 6/30/24 Nielsen “Regional Retailer” Total US TA Coffee Category sales FASTEST GROWING LARGE BRAND (RETAIL SALES
GROWTH)1 Future Future 73.7% 29.2% 18.8% 8.8% 5.5% 2.9% 1.0% 0.4% (0.7%) (3.2%) (5.7%) (8.8%)
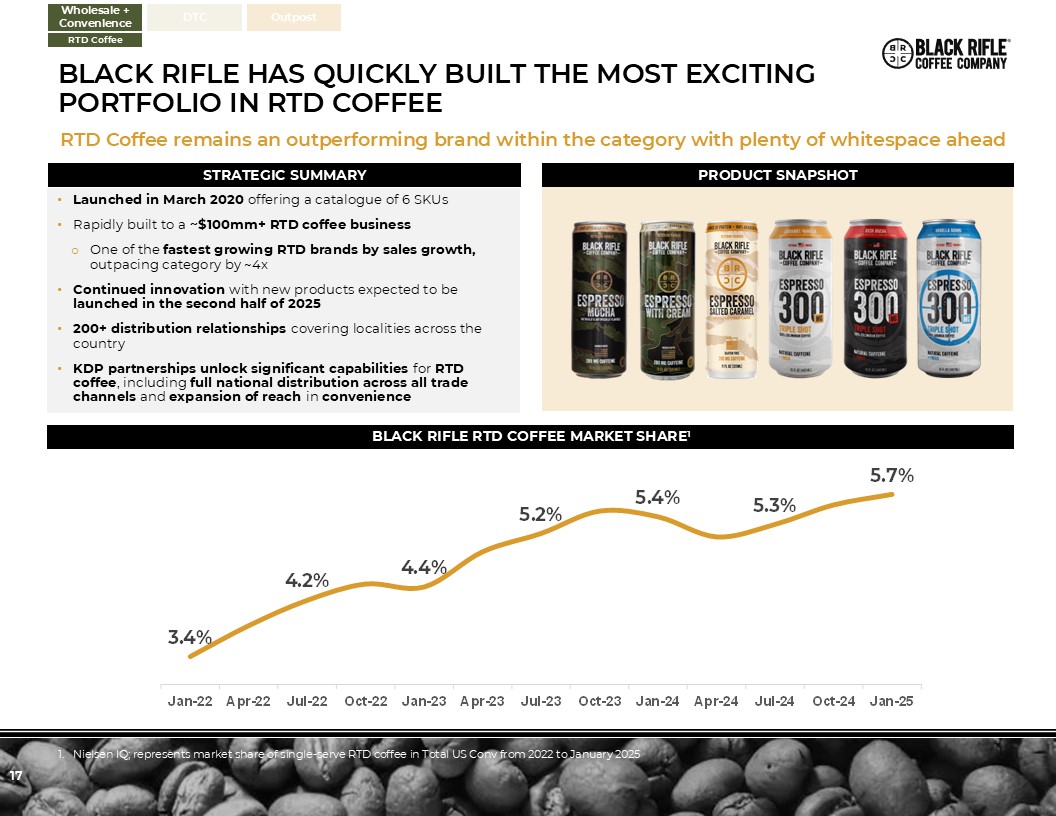
RTD Coffee remains an outperforming brand within the category with plenty of
whitespace ahead 17 STRATEGIC SUMMARY BLACK RIFLE RTD COFFEE MARKET SHARE1 Launched in March 2020 offering a catalogue of 6 SKUs Rapidly built to a ~$100mm+ RTD coffee business One of the fastest growing RTD brands by sales growth,
outpacing category by ~4x Continued innovation with new products expected to be launched in the second half of 2025 200+ distribution relationships covering localities across the country KDP partnerships unlock significant capabilities for
RTD coffee, including full national distribution across all trade channels and expansion of reach in convenience PRODUCT SNAPSHOT Nielsen IQ; represents market share of single-serve RTD coffee in Total US Conv from 2022 to January
2025 Wholesale + Convenience DTC Outpost RTD Coffee BLACK RIFLE has Quickly Built the Most Exciting Portfolio in RTD Coffee
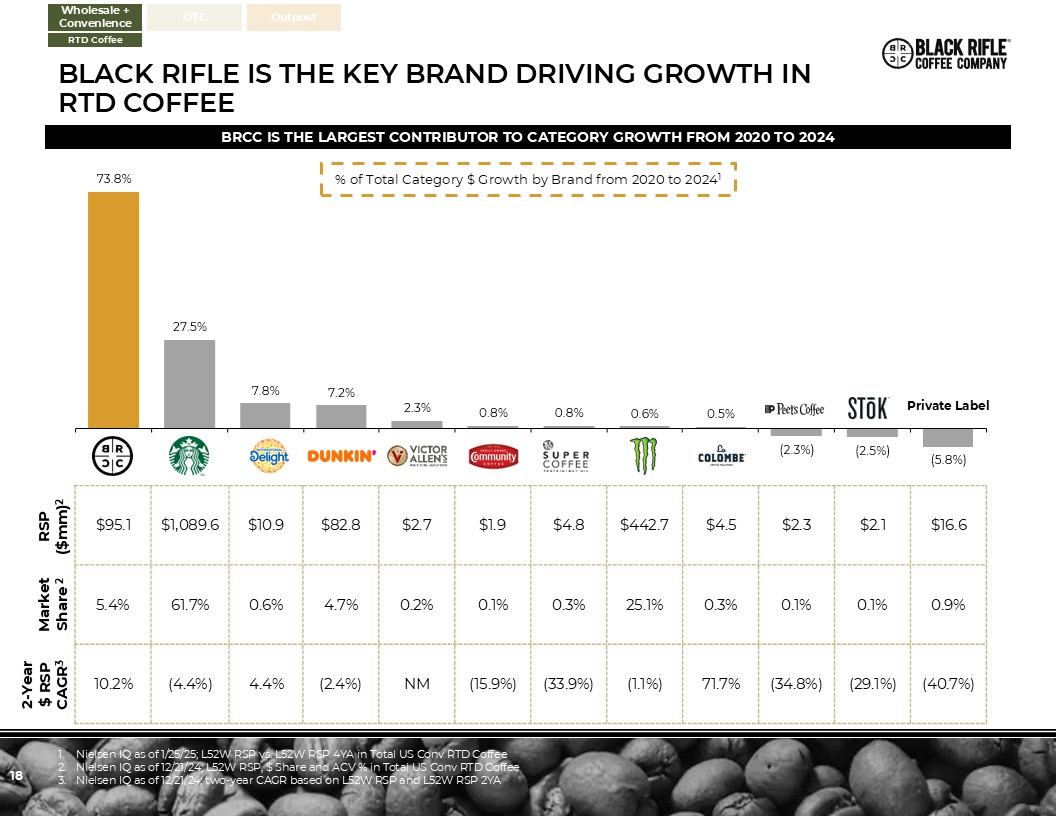
18 BRCC IS THE LARGEST CONTRIBUTOR TO CATEGORY GROWTH FROM 2020 TO 2024 % of
Total Category $ Growth by Brand from 2020 to 20241 Private Label Nielsen IQ as of 1/25/25; L52W RSP vs. L52W RSP 4YA in Total US Conv RTD Coffee Nielsen IQ as of 12/21/24; L52W RSP, $ Share and ACV % in Total US Conv RTD Coffee Nielsen
IQ as of 12/21/24; two-year CAGR based on L52W RSP and L52W RSP
2YA $95.1 $1,089.6 $10.9 $82.8 $2.7 $1.9 $4.8 $442.7 $4.5 $2.3 $2.1 $16.6 5.4% 61.7% 0.6% 4.7% 0.2% 0.1% 0.3% 25.1% 0.3% 0.1% 0.1% 0.9% 10.2% (4.4%) 4.4% (2.4%) NM (15.9%) (33.9%) (1.1%) 71.7% (34.8%) (29.1%) (40.7%) RSP
($mm)2 Market Share 2 2-Year $ RSP CAGR3 BLACK RIFLE is the Key Brand Driving Growth in RTD Coffee Wholesale + Convenience DTC Outpost RTD Coffee
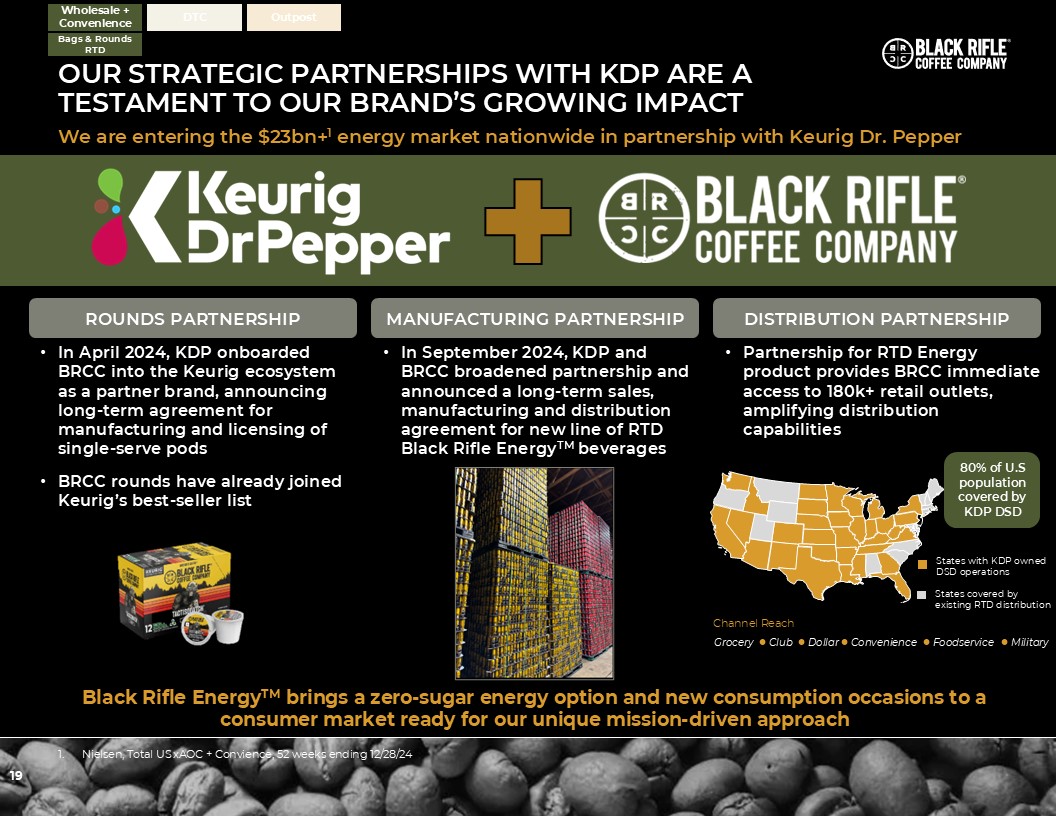
We are entering the $23bn+1 energy market nationwide in partnership with Keurig
Dr. Pepper 19 Our strategic partnerships with KDP ARE A TESTAMENT TO OUR BRAND’S GROWING IMPACT ROUNDS PARTNERSHIP In April 2024, KDP onboarded BRCC into the Keurig ecosystem as a partner brand, announcing long-term agreement for
manufacturing and licensing of single-serve pods BRCC rounds have already joined Keurig’s best-seller list DISTRIBUTION PARTNERSHIP 80% of U.S population covered by KDP DSD Black Rifle EnergyTM brings a zero-sugar energy option and new
consumption occasions to a consumer market ready for our unique mission-driven approach MANUFACTURING PARTNERSHIP States with KDP owned DSD operations States covered by existing RTD distribution Channel Reach Grocery Club Dollar
Convenience Foodservice Military Nielsen, Total US xAOC + Convience, 52 weeks ending 12/28/24 Wholesale + Convenience DTC Outpost Bags & Rounds RTD In September 2024, KDP and BRCC broadened partnership and announced a long-term
sales, manufacturing and distribution agreement for new line of RTD Black Rifle EnergyTM beverages Partnership for RTD Energy product provides BRCC immediate access to 180k+ retail outlets, amplifying distribution capabilities
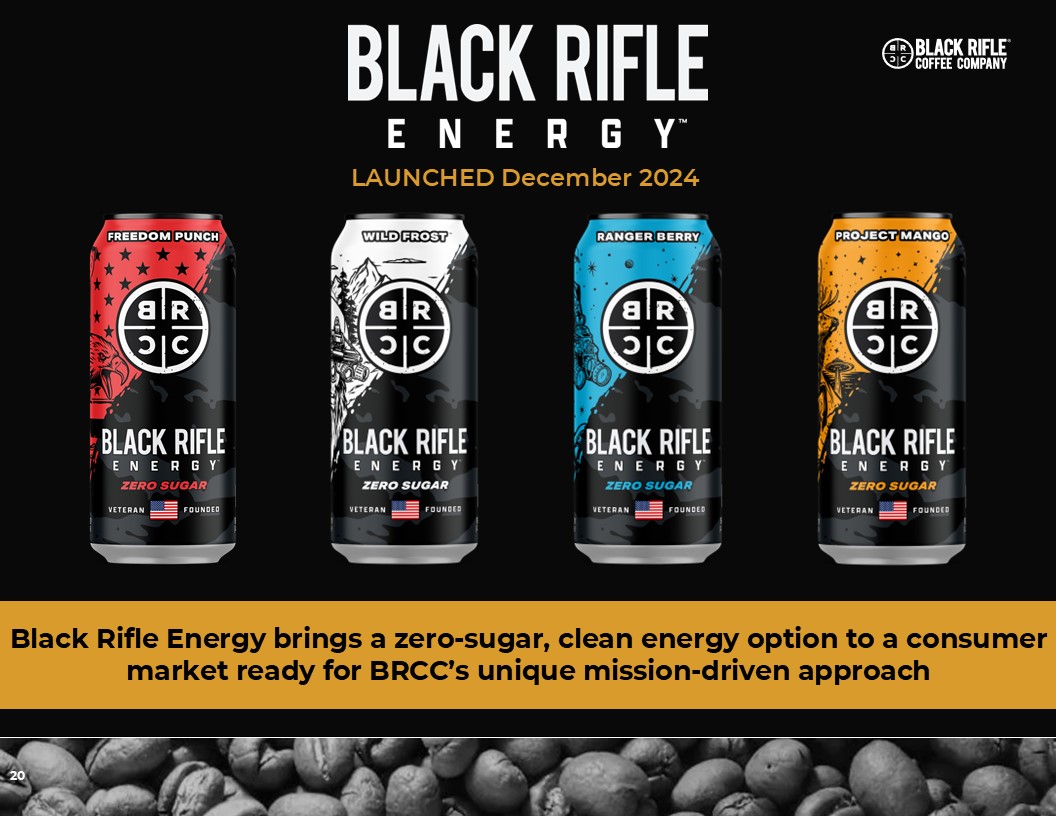
20 Black Rifle Energy brings a zero-sugar, clean energy option to a consumer
market ready for BRCC’s unique mission-driven approach LAUNCHED December 2024
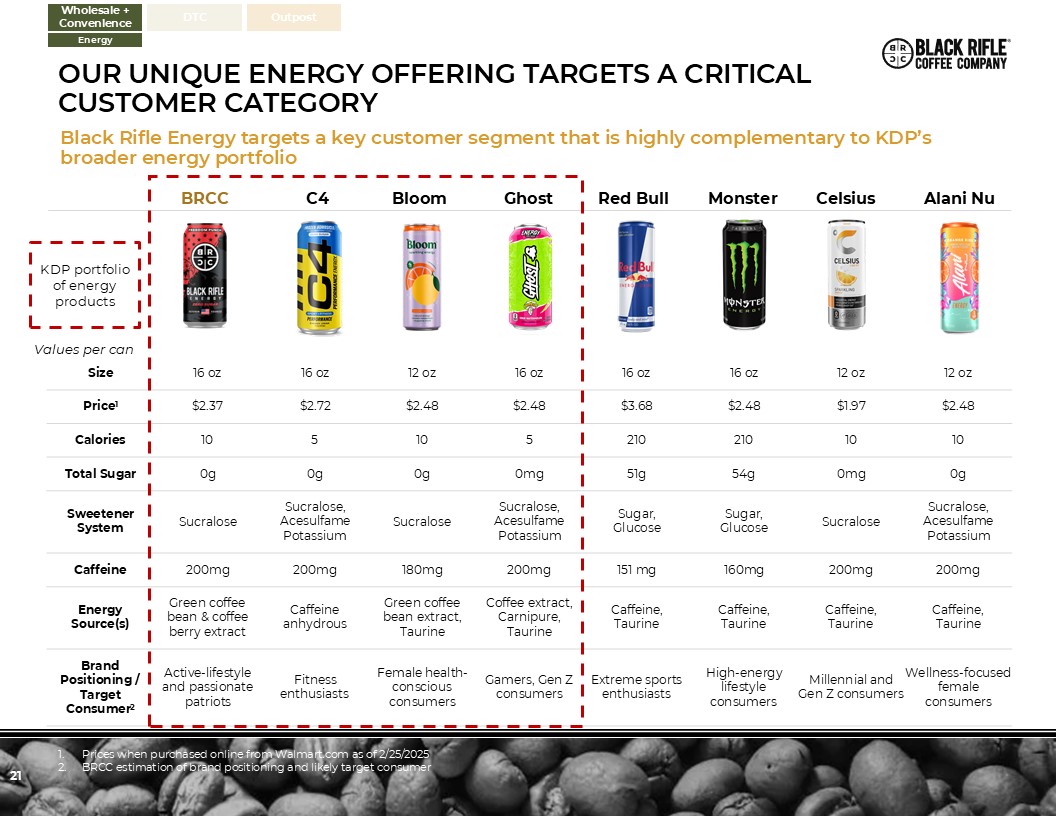
21 Size 16 oz 16 oz 12 oz 16 oz 16 oz 16 oz 12 oz 12
oz Price1 $2.37 $2.72 $2.48 $2.48 $3.68 $2.48 $1.97 $2.48 Calories 10 5 10 5 210 210 10 10 Total Sugar 0g 0g 0g 0mg 51g 54g 0mg 0g Sweetener System Sucralose Sucralose, Acesulfame Potassium Sucralose Sucralose,
Acesulfame Potassium Sugar, Glucose Sugar, Glucose Sucralose Sucralose, Acesulfame Potassium Caffeine 200mg 200mg 180mg 200mg 151 mg 160mg 200mg 200mg Energy Source(s) Green coffee bean & coffee berry
extract Caffeine anhydrous Green coffee bean extract, Taurine Coffee extract, Carnipure, Taurine Caffeine, Taurine Caffeine, Taurine Caffeine, Taurine Caffeine, Taurine Brand Positioning / Target Consumer2 Active-lifestyle
and passionate patriots Fitness enthusiasts Female health-conscious consumers Gamers, Gen Z consumers Extreme sports enthusiasts High-energy lifestyle consumers Millennial and Gen Z consumers Wellness-focused female
consumers BRCC Red Bull Monster Alani Nu Celsius Values per can C4 Bloom Ghost KDP portfolio of energy products Prices when purchased online from Walmart.com as of 2/25/2025 BRCC estimation of brand positioning and likely target
consumer Wholesale + Convenience DTC Outpost Energy Our unique energy offering targets a critical customer category Black Rifle Energy targets a key customer segment that is highly complementary to KDP’s broader energy portfolio
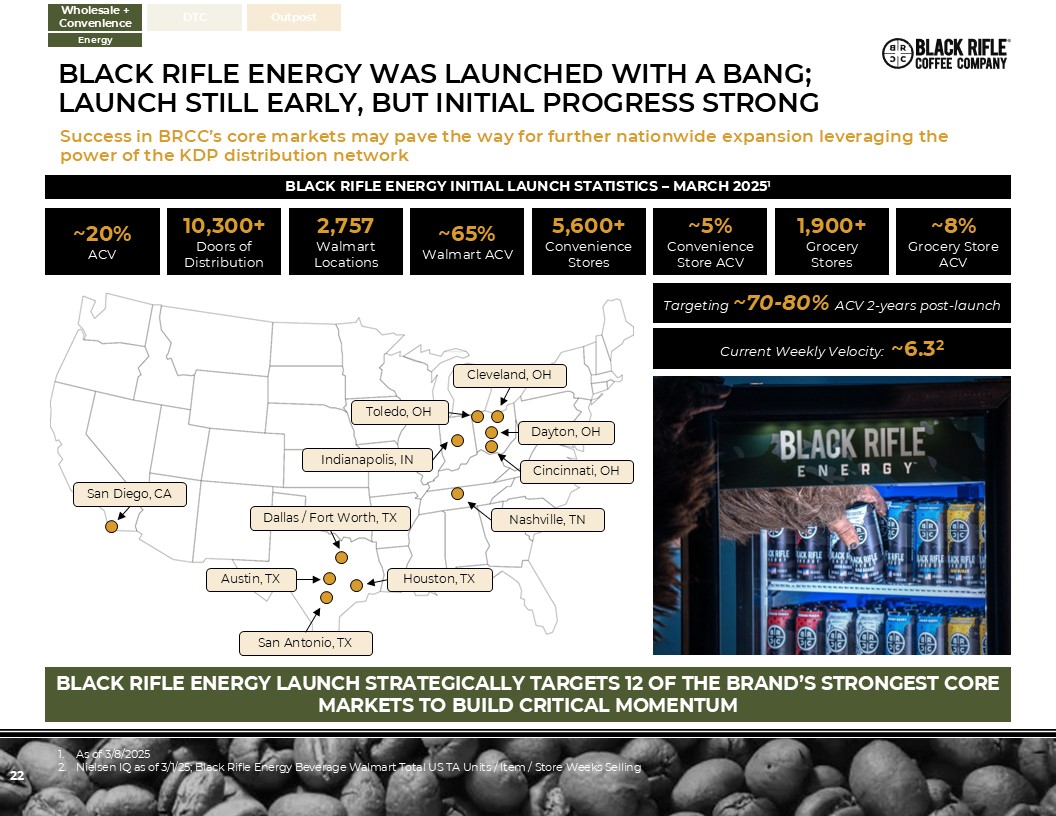
22 ~20%ACV 10,300+Doors of Distribution 2,757Walmart Locations ~65%Walmart
ACV 5,600+Convenience Stores ~5%Convenience Store ACV 1,900+Grocery Stores ~8%Grocery Store ACV BLACK RIFLE ENERGY INITIAL LAUNCH STATISTICS – MARCH 20251 As of 3/8/2025 Nielsen IQ as of 3/1/25; Black Rifle Energy Beverage Walmart
Total US TA Units / Item / Store Weeks Selling Austin, TX BLACK RIFLE ENERGY LAUNCH STRATEGICALLY TARGETS 12 OF THE BRAND’S STRONGEST CORE MARKETS TO BUILD CRITICAL MOMENTUM Cincinnati, OH Cleveland, OH Dallas / Fort Worth, TX Dayton,
OH Houston, TX San Antonio, TX Indianapolis, IN Nashville, TN Toledo, OH San Diego, CA Targeting ~70-80% ACV 2-years post-launch Current Weekly Velocity: ~6.32 Wholesale + Convenience DTC Outpost Energy Black rifle energy was
launched with a bang; Launch still early, but initial progress Strong Success in BRCC’s core markets may pave the way for further nationwide expansion leveraging the power of the KDP distribution network
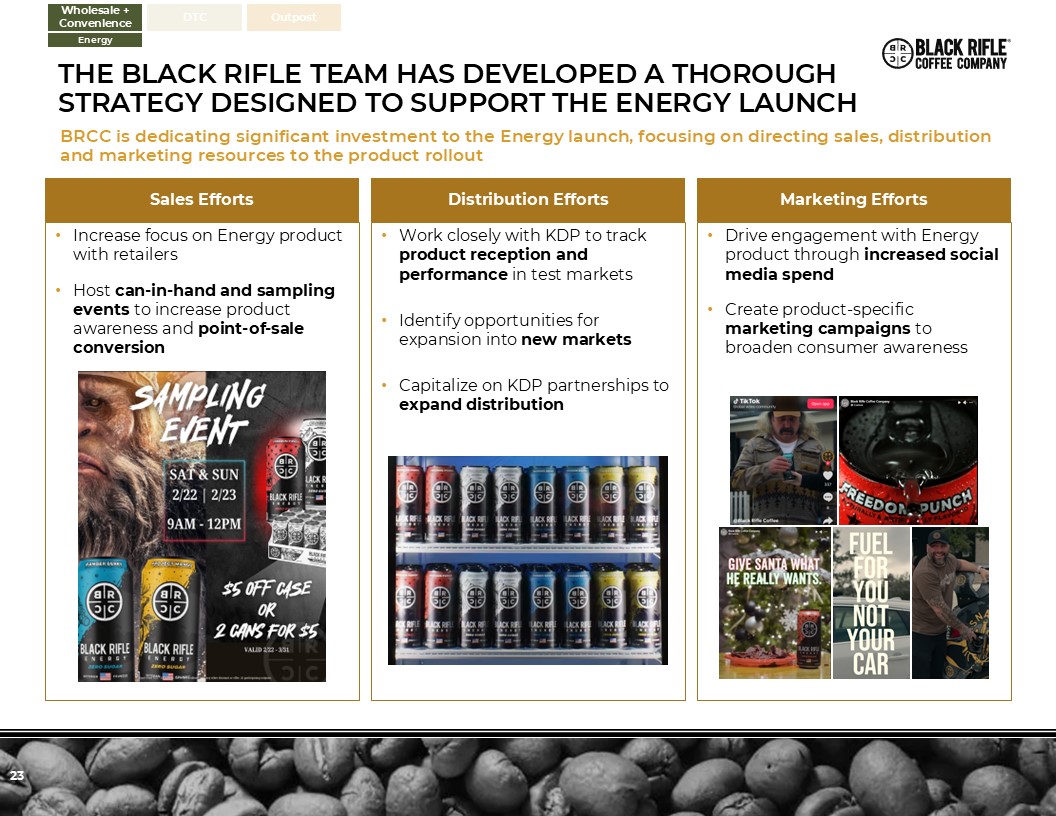
23 Marketing Efforts Distribution Efforts Sales Efforts Increase focus on
Energy product with retailers Host can-in-hand and sampling events to increase product awareness and point-of-sale conversion Work closely with KDP to track product reception and performance in test markets Identify opportunities for
expansion into new markets Capitalize on KDP partnerships to expand distribution Drive engagement with Energy product through increased social media spend Create product-specific marketing campaigns to broaden consumer awareness
Wholesale + Convenience DTC Outpost Energy The Black rifle team has developed a thorough strategy designed to support the energy launch BRCC is dedicating significant investment to the Energy launch, focusing on directing sales,
distribution and marketing resources to the product rollout
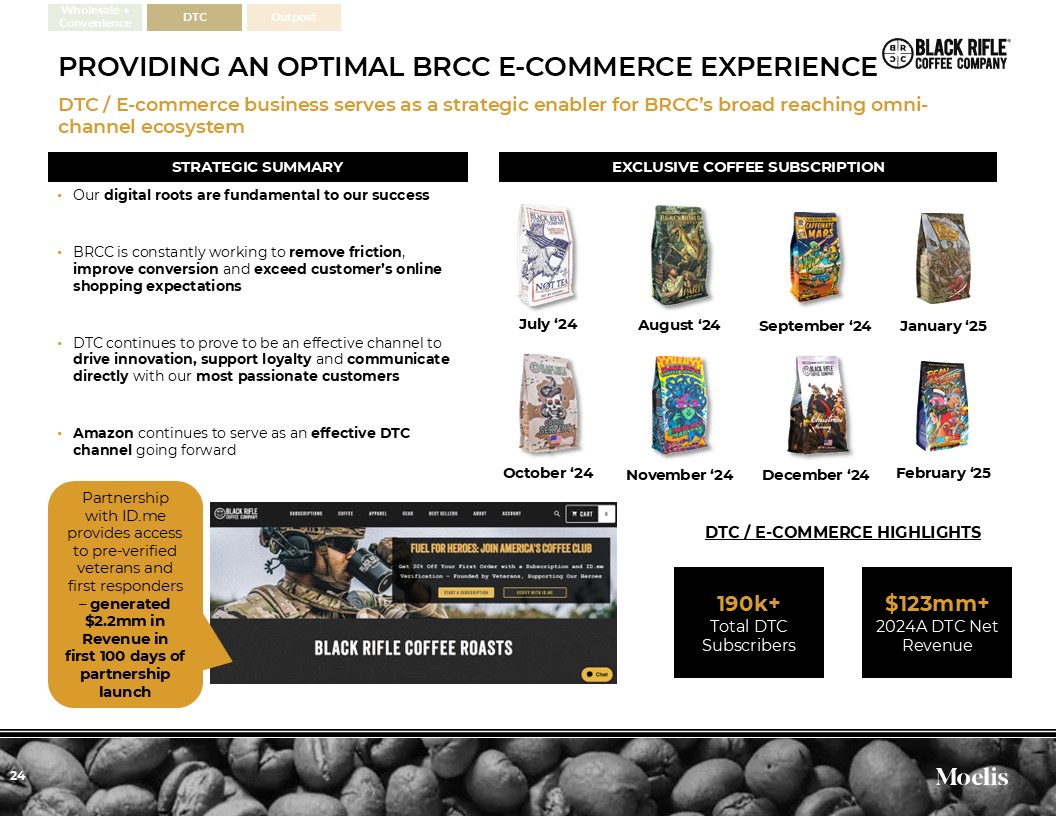
24 DTC / E-COMMERCE HIGHLIGHTS 190k+Total DTC Subscribers $123mm+2024A DTC
Net Revenue Our digital roots are fundamental to our success BRCC is constantly working to remove friction, improve conversion and exceed customer’s online shopping expectations DTC continues to prove to be an effective channel to drive
innovation, support loyalty and communicate directly with our most passionate customers Amazon continues to serve as an effective DTC channel going forward Partnership with ID.me provides access to pre-verified veterans and first responders
– generated $2.2mm in Revenue in first 100 days of partnership launch STRATEGIC SUMMARY EXCLUSIVE COFFEE SUBSCRIPTION Wholesale + Convenience DTC Outpost December ‘24 November ‘24 October ‘24 September ‘24 August ‘24 July
‘24 January ‘25 February ‘25 PROVIDING AN OPTIMAL BRCC E-COMMERCE EXPERIENCE DTC / E-commerce business serves as a strategic enabler for BRCC’s broad reaching omni-channel ecosystem
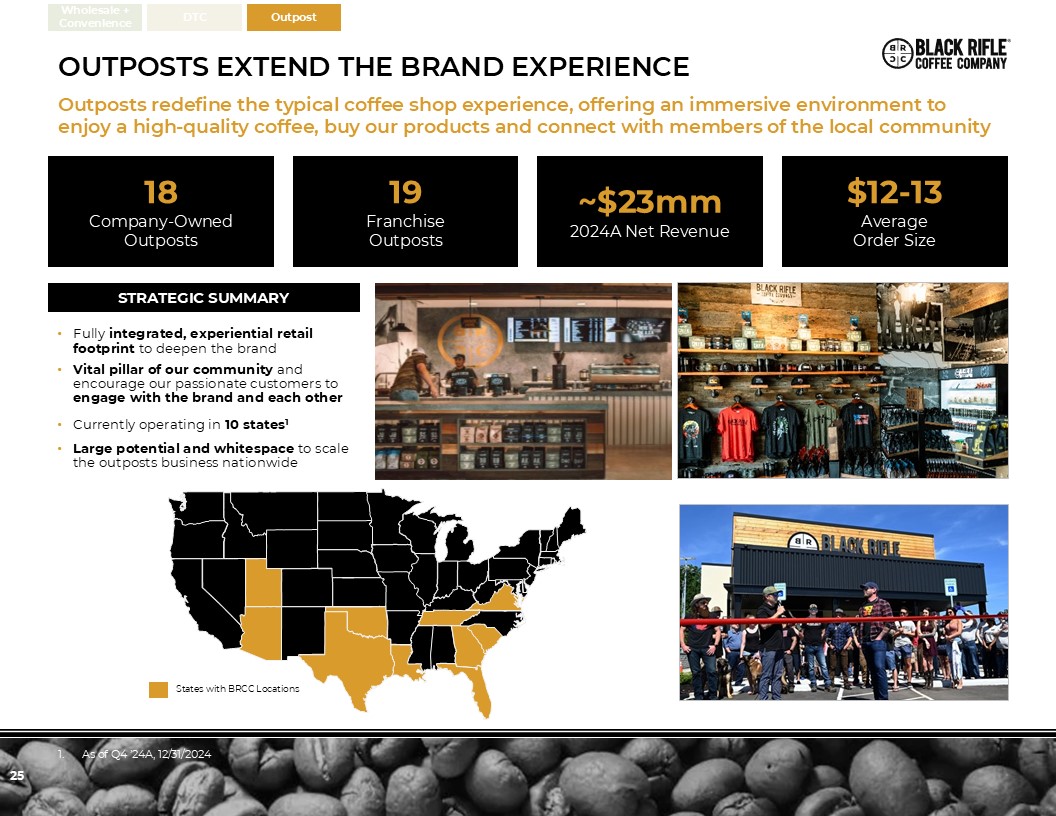
25 outposts extend the brand experience Outposts redefine the typical coffee
shop experience, offering an immersive environment to enjoy a high-quality coffee, buy our products and connect with members of the local community 18Company-Owned Outposts 19Franchise Outposts ~$23mm2024A Net Revenue $12-13Average
Order Size Fully integrated, experiential retail footprint to deepen the brand Vital pillar of our community and encourage our passionate customers to engage with the brand and each other Currently operating in 10 states1 Large
potential and whitespace to scale the outposts business nationwide States with BRCC Locations STRATEGIC SUMMARY As of Q4 ’24A, 12/31/2024 Wholesale + Convenience DTC Outpost
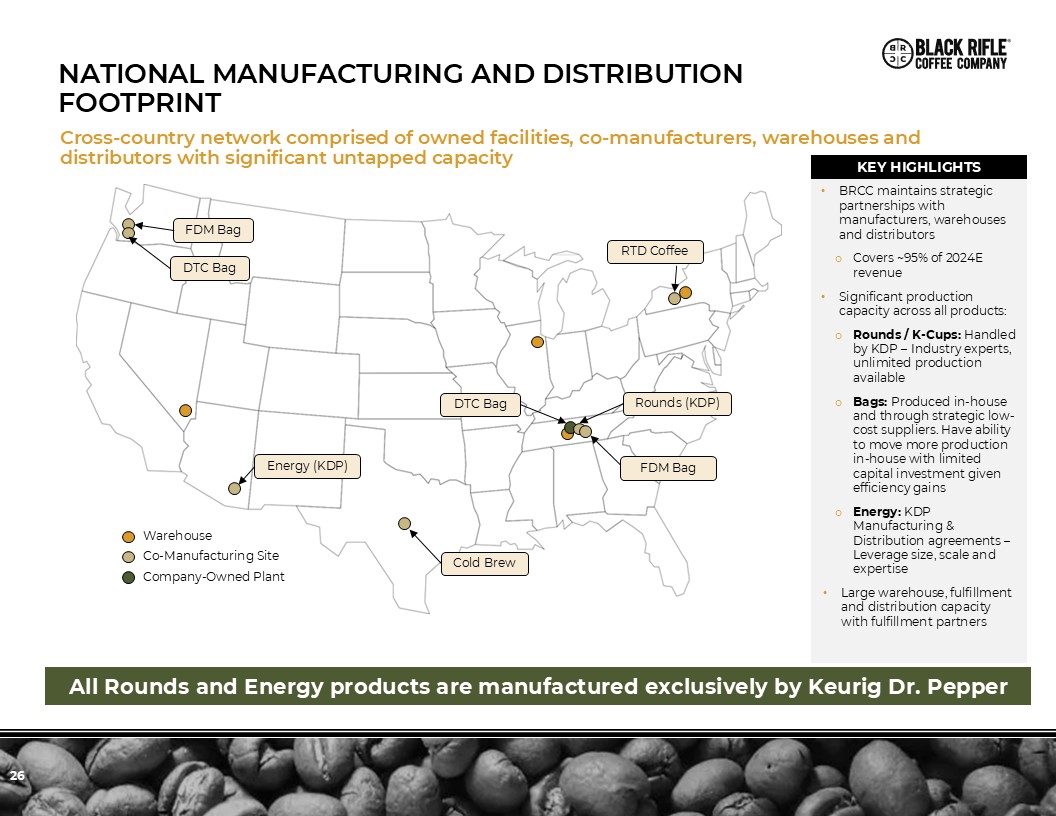
26 Warehouse Co-Manufacturing Site Company-Owned Plant FDM Bag DTC
Bag Energy (KDP) Cold Brew RTD Coffee Rounds (KDP) FDM Bag DTC Bag All Rounds and Energy products are manufactured exclusively by Keurig Dr. Pepper KEY HIGHLIGHTS BRCC maintains strategic partnerships with manufacturers, warehouses
and distributors Covers ~95% of 2024E revenue Significant production capacity across all products: Rounds / K-Cups: Handled by KDP – Industry experts, unlimited production available Bags: Produced in-house and through strategic low-cost
suppliers. Have ability to move more production in-house with limited capital investment given efficiency gains Energy: KDP Manufacturing & Distribution agreements – Leverage size, scale and expertise Large warehouse, fulfillment and
distribution capacity with fulfillment partners National manufacturing and distribution footprint Cross-country network comprised of owned facilities, co-manufacturers, warehouses and distributors with significant untapped capacity
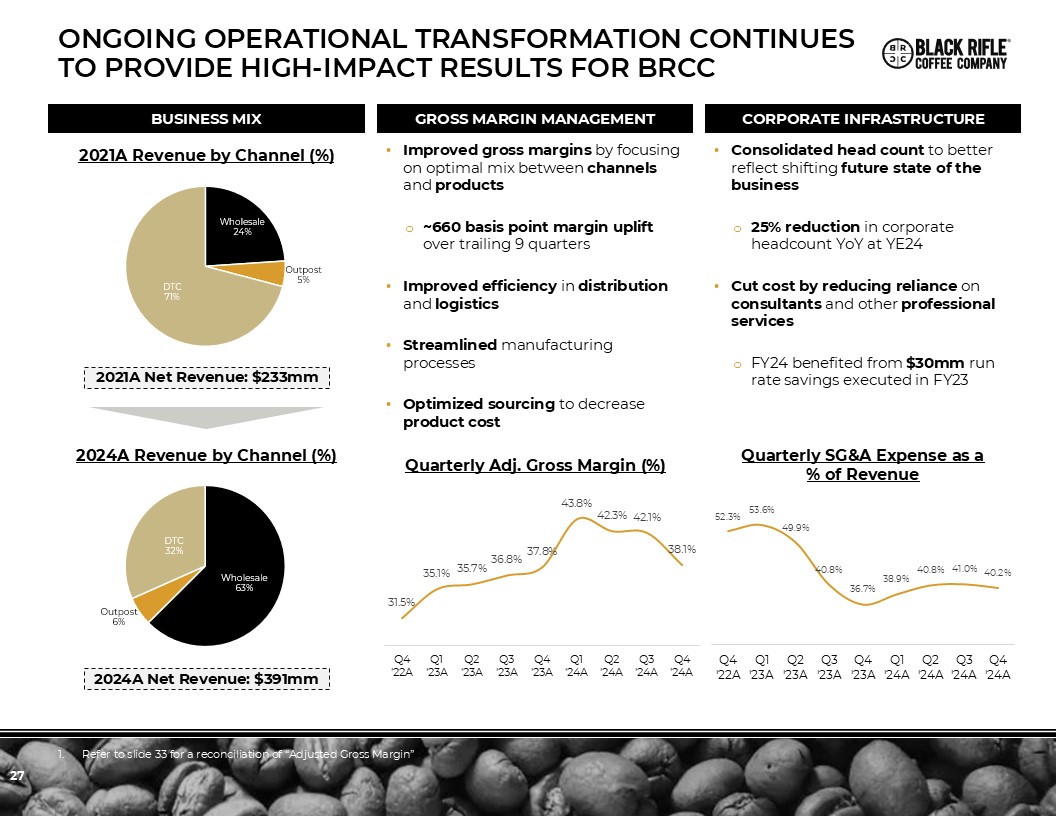
27 GROSS MARGIN MANAGEMENT Quarterly Adj. Gross Margin (%) CORPORATE
INFRASTRUCTURE Consolidated head count to better reflect shifting future state of the business 25% reduction in corporate headcount YoY at YE24 Cut cost by reducing reliance on consultants and other professional services FY24 benefited
from $30mm run rate savings executed in FY23 Quarterly SG&A Expense as a % of Revenue BUSINESS MIX 2021A Revenue by Channel (%) 2024A Revenue by Channel (%) 2024A Net Revenue: $391mm 2021A Net Revenue: $233mm Improved gross margins
by focusing on optimal mix between channels and products ~660 basis point margin uplift over trailing 9 quarters Improved efficiency in distribution and logistics Streamlined manufacturing processes Optimized sourcing to decrease
product cost ONGOING OPERATIONAL TRANSFORMATION CONTINUES TO PROVIDE HIGH-IMPACT RESULTS FOR BRCC Refer to slide 33 for a reconciliation of “Adjusted Gross Margin”
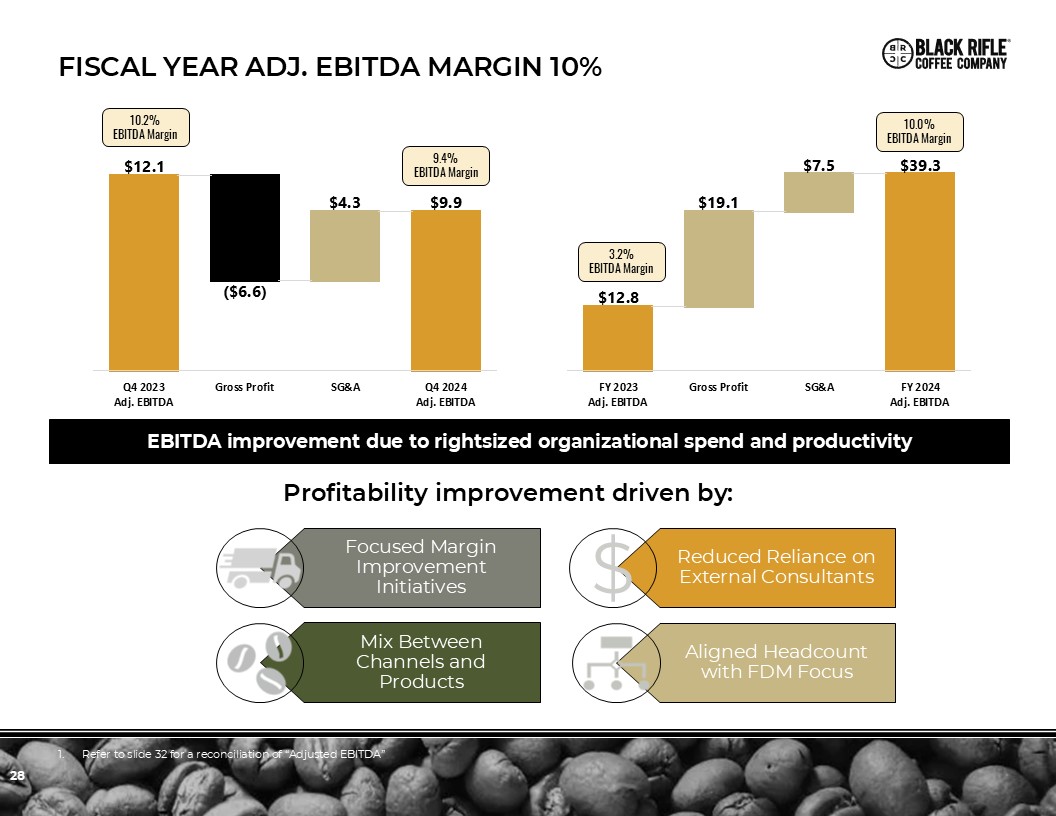
28 FISCAL YEAR ADJ. EBITDA MARGIN 10% Profitability improvement driven
by: EBITDA improvement due to rightsized organizational spend and productivity Reduced Reliance on External Consultants Aligned Headcount with FDM Focus Mix Between Channels and Products Focused Margin Improvement
Initiatives 9.4% EBITDA Margin 10.2% EBITDA Margin 3.2% EBITDA Margin 10.0% EBITDA Margin $ Refer to slide 32 for a reconciliation of “Adjusted EBITDA”
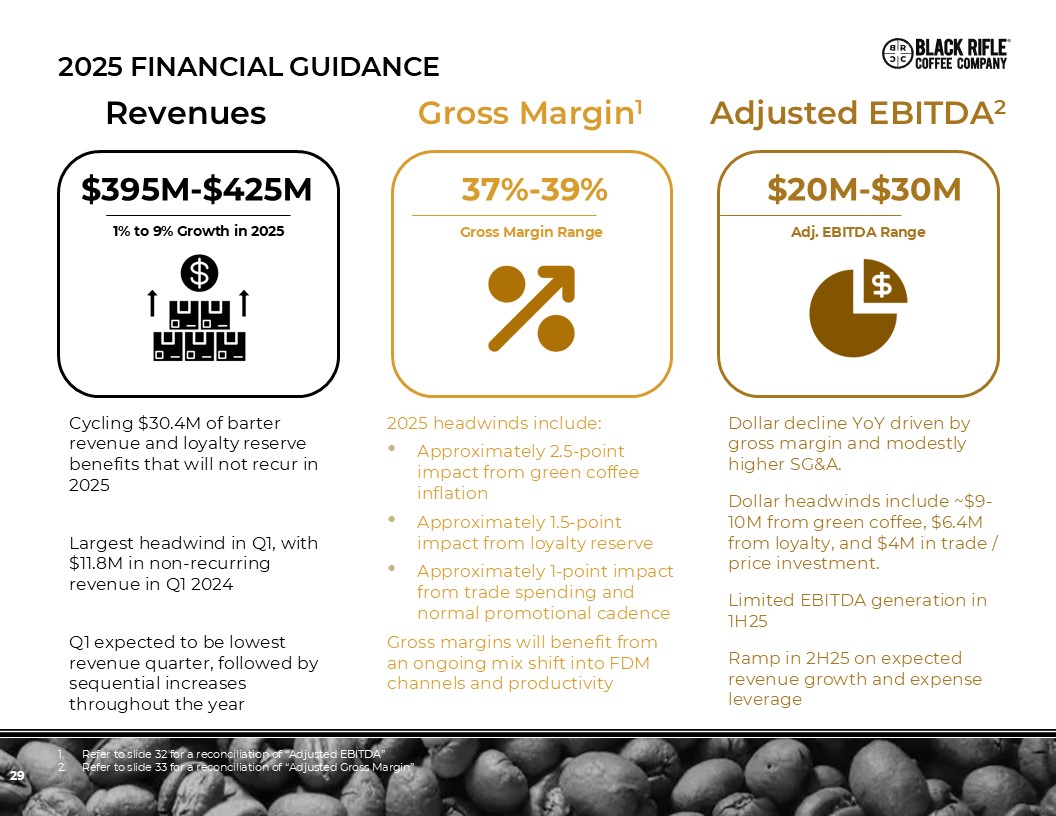
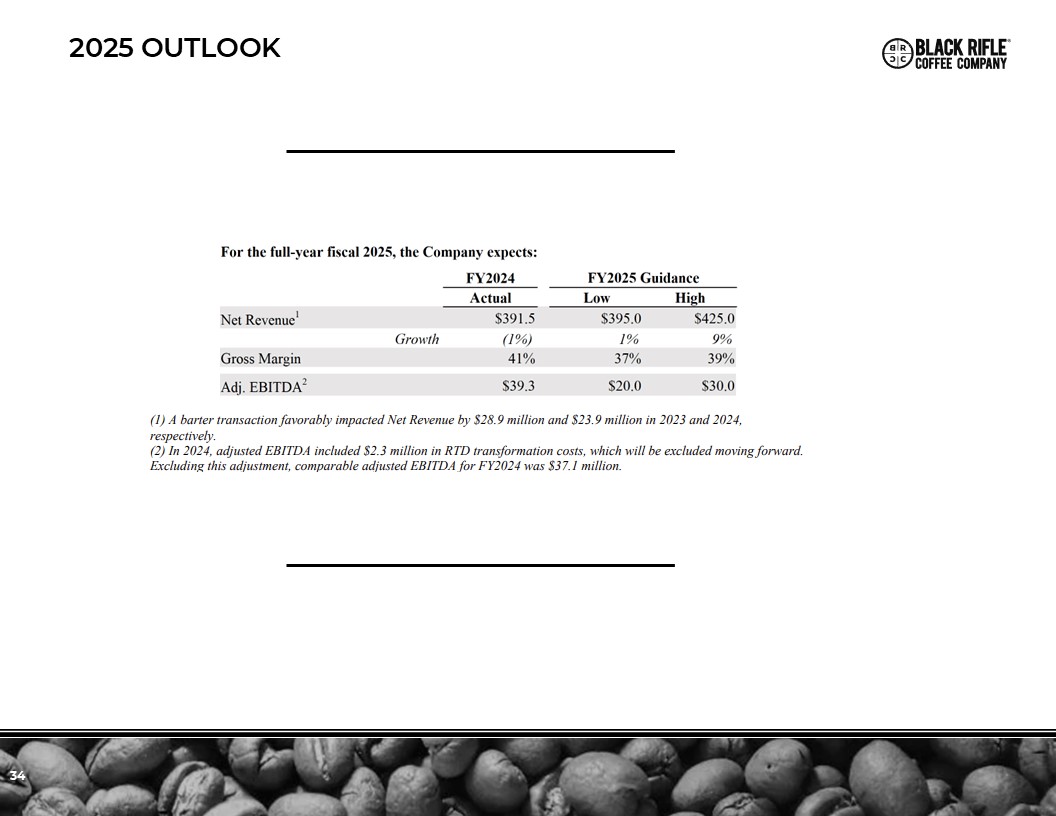
29 2025 financial gUIDANCE Revenues Gross Margin1 Adjusted
EBITDA2 $395M-$425M 1% to 9% Growth in 2025 37%-39% Gross Margin Range $20M-$30M Adj. EBITDA Range Cycling $30.4M of barter revenue and loyalty reserve benefits that will not recur in 2025 Largest headwind in Q1, with $11.8M in
non-recurring revenue in Q1 2024 Q1 expected to be lowest revenue quarter, followed by sequential increases throughout the year 2025 headwinds include: Approximately 2.5-point impact from green coffee inflation Approximately 1.5-point
impact from loyalty reserve Approximately 1-point impact from trade spending and normal promotional cadence Gross margins will benefit from an ongoing mix shift into FDM channels and productivity Dollar decline YoY driven by gross margin
and modestly higher SG&A. Dollar headwinds include ~$9-10M from green coffee, $6.4M from loyalty, and $4M in trade / price investment. Limited EBITDA generation in 1H25 Ramp in 2H25 on expected revenue growth and expense
leverage Refer to slide 32 for a reconciliation of “Adjusted EBITDA” Refer to slide 33 for a reconciliation of “Adjusted Gross Margin”
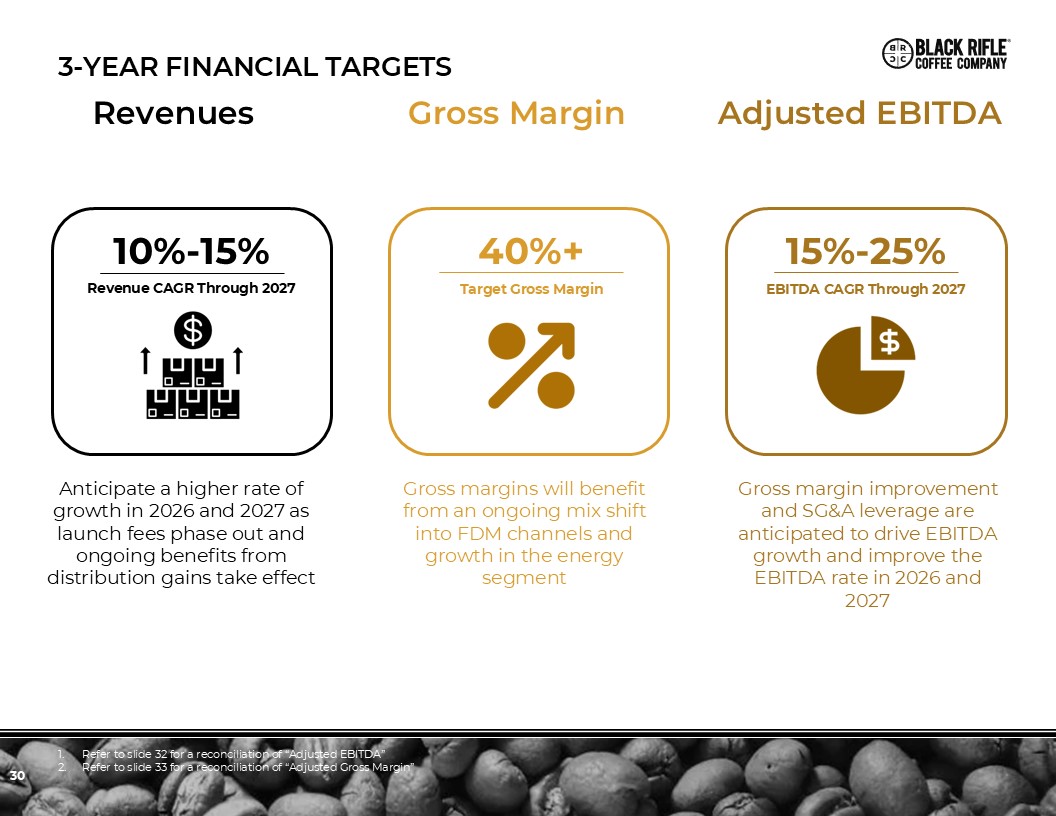
30 3-Year Financial Targets Revenues Gross Margin Adjusted
EBITDA 10%-15% Revenue CAGR Through 2027 40%+ Target Gross Margin 15%-25% EBITDA CAGR Through 2027 Anticipate a higher rate of growth in 2026 and 2027 as launch fees phase out and ongoing benefits from distribution gains take
effect Gross margins will benefit from an ongoing mix shift into FDM channels and growth in the energy segment Gross margin improvement and SG&A leverage are anticipated to drive EBITDA growth and improve the EBITDA rate in 2026 and
2027 Refer to slide 32 for a reconciliation of “Adjusted EBITDA” Refer to slide 33 for a reconciliation of “Adjusted Gross Margin”
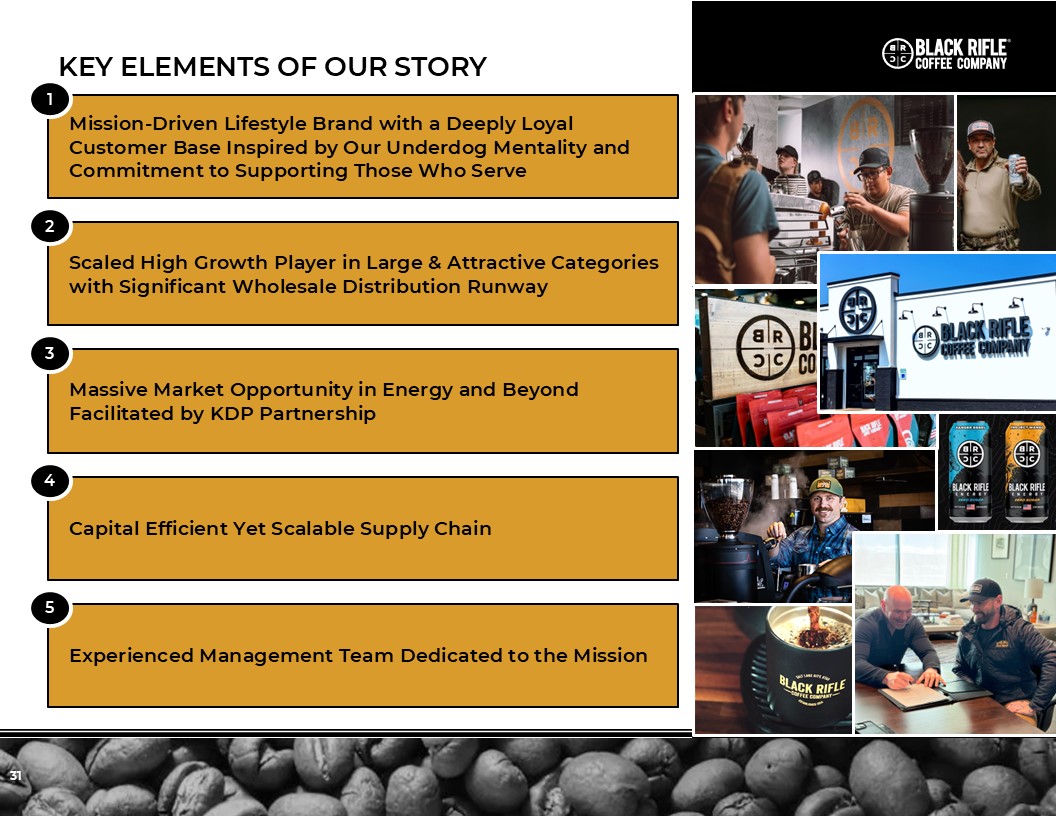
31 KEY ELEMENTS OF OUR STORY Mission-Driven Lifestyle Brand with a Deeply
Loyal Customer Base Inspired by Our Underdog Mentality and Commitment to Supporting Those Who Serve 1 Scaled High Growth Player in Large & Attractive Categories with Significant Wholesale Distribution Runway 2 Massive Market
Opportunity in Energy and Beyond Facilitated by KDP Partnership 3 Capital Efficient Yet Scalable Supply Chain 4 Experienced Management Team Dedicated to the Mission 5
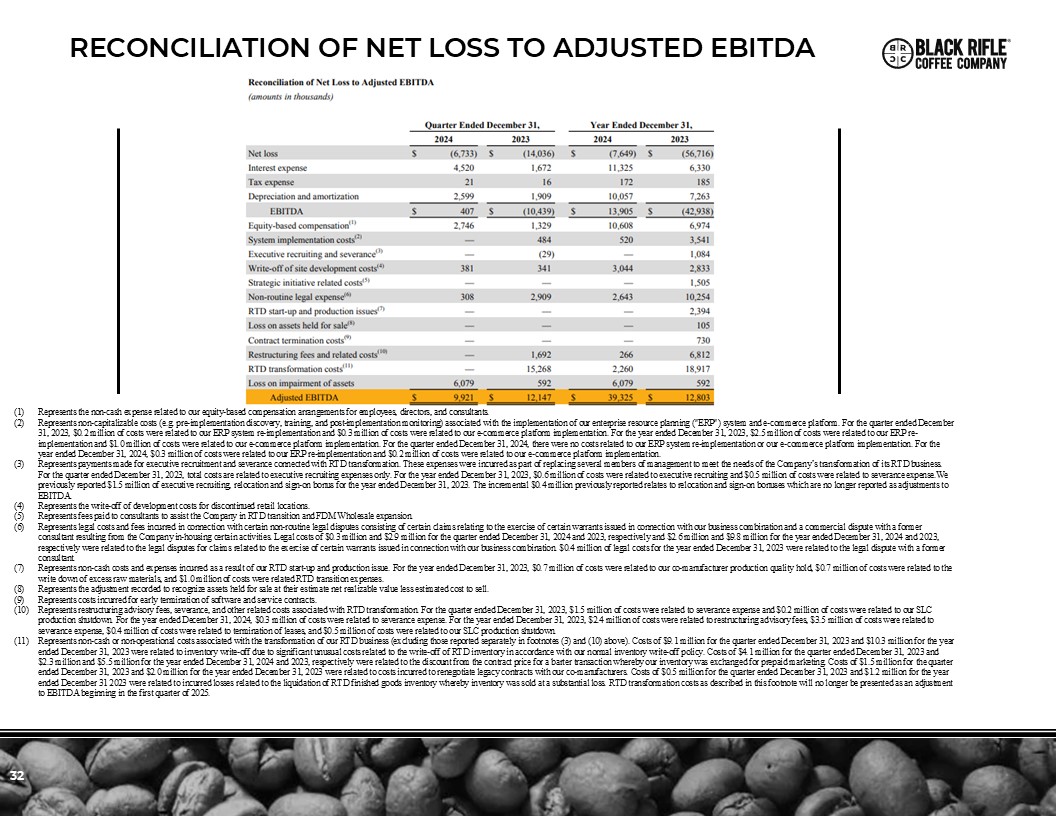
32 RECONCILIATION OF NET LOSS TO ADJUSTED EBITDA Represents the non-cash
expense related to our equity-based compensation arrangements for employees, directors, and consultants. Represents non-capitalizable costs (e.g. pre-implementation discovery, training, and post-implementation monitoring) associated with the
implementation of our enterprise resource planning ("ERP") system and e-commerce platform. For the quarter ended December 31, 2023, $0.2 million of costs were related to our ERP system re-implementation and $0.3 million of costs were related
to our e-commerce platform implementation. For the year ended December 31, 2023, $2.5 million of costs were related to our ERP re-implementation and $1.0 million of costs were related to our e-commerce platform implementation. For the quarter
ended December 31, 2024, there were no costs related to our ERP system re-implementation or our e-commerce platform implementation. For the year ended December 31, 2024, $0.3 million of costs were related to our ERP re-implementation and $0.2
million of costs were related to our e-commerce platform implementation. Represents payments made for executive recruitment and severance connected with RTD transformation. These expenses were incurred as part of replacing several members of
management to meet the needs of the Company’s transformation of its RTD business. For the quarter ended December 31, 2023, total costs are related to executive recruiting expenses only. For the year ended December 31, 2023, $0.6 million of
costs were related to executive recruiting and $0.5 million of costs were related to severance expense.We previously reported $1.5 million of executive recruiting, relocation and sign-on bonus for the year ended December 31, 2023. The
incremental $0.4 million previously reported relates to relocation and sign-on bonuses which are no longer reported as adjustments to EBITDA. Represents the write-off of development costs for discontinued retail locations. Represents fees
paid to consultants to assist the Company in RTD transition and FDM Wholesale expansion. Represents legal costs and fees incurred in connection with certain non-routine legal disputes consisting of certain claims relating to the exercise of
certain warrants issued in connection with our business combination and a commercial dispute with a former consultant resulting from the Company in-housing certain activities. Legal costs of $0.3 million and $2.9 million for the quarter ended
December 31, 2024 and 2023, respectively and $2.6 million and $9.8 million for the year ended December 31, 2024 and 2023, respectively were related to the legal disputes for claims related to the exercise of certain warrants issued in
connection with our business combination. $0.4 million of legal costs for the year ended December 31, 2023 were related to the legal dispute with a former consultant. Represents non-cash costs and expenses incurred as a result of our RTD
start-up and production issue. For the year ended December 31, 2023, $0.7 million of costs were related to our co-manufacturer production quality hold, $0.7 million of costs were related to the write down of excess raw materials, and $1.0
million of costs were related RTD transition expenses. Represents the adjustment recorded to recognize assets held for sale at their estimate net realizable value less estimated cost to sell. Represents costs incurred for early termination
of software and service contracts. Represents restructuring advisory fees, severance, and other related costs associated with RTD transformation. For the quarter ended December 31, 2023, $1.5 million of costs were related to severance
expense and $0.2 million of costs were related to our SLC production shutdown. For the year ended December 31, 2024, $0.3 million of costs were related to severance expense. For the year ended December 31, 2023, $2.4 million of costs were
related to restructuring advisory fees, $3.5 million of costs were related to severance expense, $0.4 million of costs were related to termination of leases, and $0.5 million of costs were related to our SLC production shutdown. Represents
non-cash or non-operational costs associated with the transformation of our RTD business (excluding those reported separately in footnotes (3) and (10) above). Costs of $9.1 million for the quarter ended December 31, 2023 and $10.3 million
for the year ended December 31, 2023 were related to inventory write-off due to significant unusual costs related to the write-off of RTD inventory in accordance with our normal inventory write-off policy. Costs of $4.1 million for the
quarter ended December 31, 2023 and $2.3 million and $5.5 million for the year ended December 31, 2024 and 2023, respectively were related to the discount from the contract price for a barter transaction whereby our inventory was exchanged
for prepaid marketing. Costs of $1.5 million for the quarter ended December 31, 2023 and $2.0 million for the year ended December 31, 2023 were related to costs incurred to renegotiate legacy contracts with our co-manufacturers. Costs of $0.5
million for the quarter ended December 31, 2023 and $1.2 million for the year ended December 31 2023 were related to incurred losses related to the liquidation of RTD finished goods inventory whereby inventory was sold at a substantial loss.
RTD transformation costs as described in this footnote will no longer be presented as an adjustment to EBITDA beginning in the first quarter of 2025.
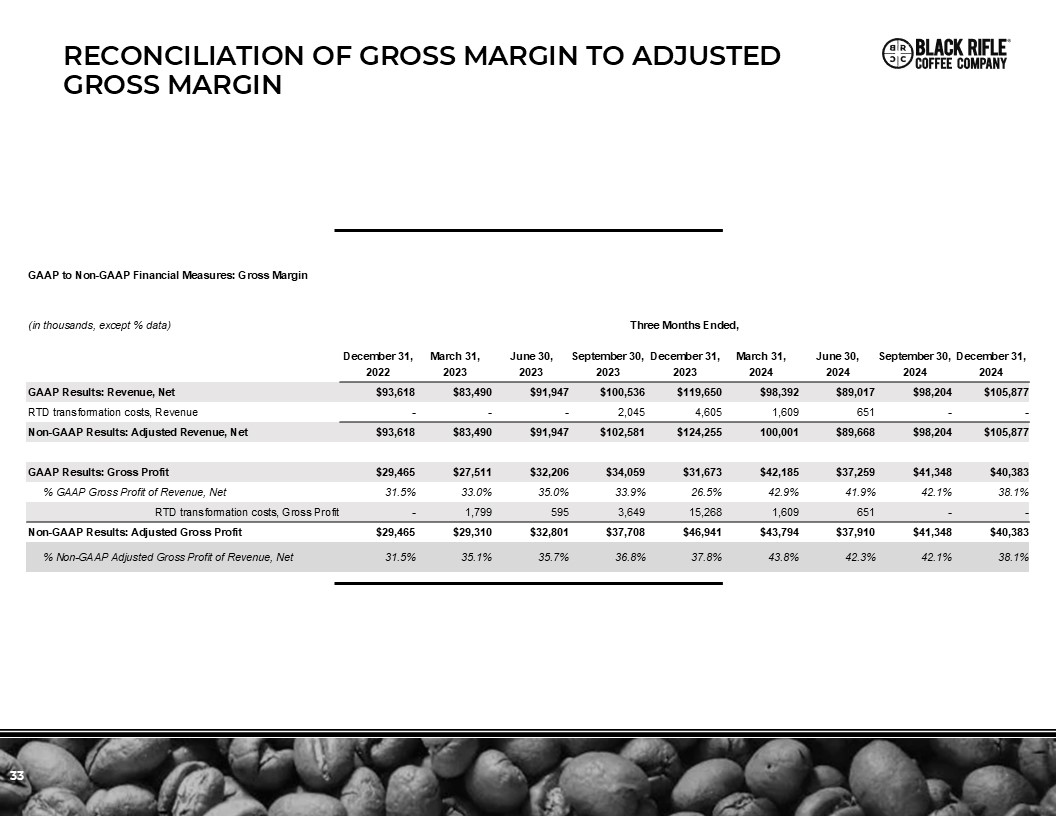
33 RECONCILIATION OF GROSS MARGIN TO ADJUSTED GROSS MARGIN GAAP to Non-GAAP
Financial Measures: Gross Margin (in thousands, except % data) Three Months Ended, December 31, March 31, June 30, September 30, December 31, March 31, June 30, September 30, December
31, 2022 2023 2023 2023 2023 2024 2024 2024 2024 GAAP Results: Revenue, Net $93,618 $83,490 $91,947 $100,536 $119,650 $98,392 $89,017 $98,204 $105,877 RTD transformation costs,
Revenue - - - 2,045 4,605 1,609 651 - - Non-GAAP Results: Adjusted Revenue, Net $93,618 $83,490 $91,947 $102,581 $124,255 100,001 $89,668 $98,204 $105,877 GAAP Results: Gross Profit $29,465 $27,511 $32,206
$34,059 $31,673 $42,185 $37,259 $41,348 $40,383 % GAAP Gross Profit of Revenue, Net 31.5% 33.0% 35.0% 33.9% 26.5% 42.9% 41.9% 42.1% 38.1% RTD transformation costs, Gross
Profit - 1,799 595 3,649 15,268 1,609 651 - - Non-GAAP Results: Adjusted Gross Profit $29,465 $29,310 $32,801 $37,708 $46,941 $43,794 $37,910 $41,348 $40,383 % Non-GAAP Adjusted Gross Profit of Revenue,
Net 31.5% 35.1% 35.7% 36.8% 37.8% 43.8% 42.3% 42.1% 38.1%
34 2025 OUTLOOK