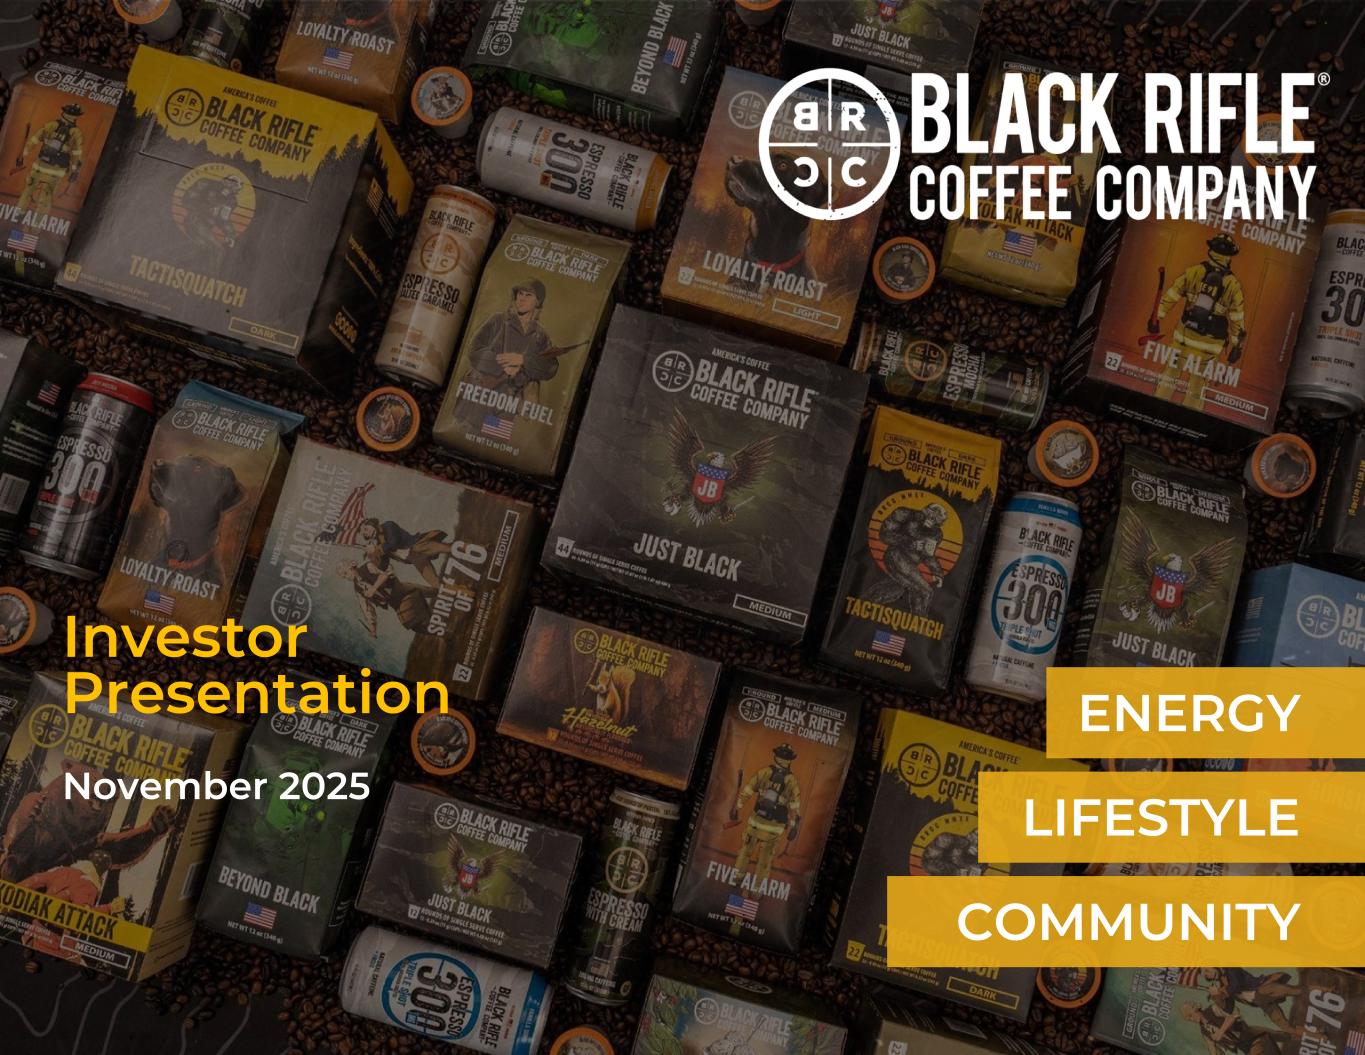
November 2025 Investor Presentation ENERGY LIFESTYLE COMMUNITY
1 DISCLAIMER Forward-Looking Statements This presentation contains forward-looking statements about BRC Inc. (the “Company,” “we,” “us,” and “our”) and its industry that involve substantial risks and uncertainties. All statements other than statements of historical fact contained in this presentation, including statements regarding the Company’s intentions, beliefs or current expectations concerning, among other things, the Company’s financial condition, liquidity, prospects, growth, strategies, future market conditions, developments in the capital and credit markets and expected future financial performance, as well as any information concerning possible or assumed future results of operations, are forward-looking statements. In some cases, you can identify forward-looking statements because they contain words such as “anticipate,” “believe,” “continue,” “could,” “estimate,” “expect,” “intend,” “may,” “might,” “plan,” “possible,” “potential,” “predict,” “project,” “should,” “will,” “would” and similar expressions, but the absence of these words does not mean that a statement is not forward-looking. The events and circumstances reflected in the Company’s forward-looking statements may not be achieved or occur and actual results could differ materially from those projected in the forward- looking statements. Factors that may cause such forward-looking statements to differ from actual results include, but are not limited to: competition and our ability to grow, manage sustainable expansion, and retain key employees; failure to compete effectively with other producers, distributors and retailers of coffee and energy drinks; our limited operating history, which may hinder the successful execution of strategic initiatives and make it difficult to assess future risks and challenges; challenges in managing rapid growth, inventory needs, and relationships with key business partners; inability to raise additional capital necessary for business development; failure to achieve or sustain long-term profitability; inability to effectively manage debt obligations; failure to maximize the value of assets received through bartering transactions; negative publicity affecting our brand, reputation, or that of key employees; failure to uphold our position as a supportive member of the Veteran, military and first-responder communities, or other factors negatively affecting brand perception; inability to establish and maintain strong brand recognition through intellectual property or other means; shifts in consumer spending, lack of interest in new products or changes in brand perception upon evolving consumer preferences and tastes, including due to shifts in demographic or health and wellness trends, reduction in discretionary spending and price increases, and our ability to anticipate or react to these changes; price changes that are insufficient to offset cost increases and maintain profitability or that result in sales volume declines associated with pricing elasticity; unsuccessful marketing campaigns that incur costs without attracting new customers or realizing higher revenue; failure to attract new customers or retain existing customers; risks associated with reliance on social media platforms, including dependence on third-party platforms for marketing and engagement; declining performance of the direct to consumer revenue channel; inability to effectively manage or scale distribution through Wholesale business partners, particularly key Wholesale partners; failure to manage supply chain operations effectively, including inaccurate forecasting of raw material and co-manufacturing requirements; loss of one or more co- manufacturers or production delays, quality issues, or labor-related disruptions affecting manufacturing output; supply chain disruptions or failures by third-party suppliers to deliver coffee, store supplies, RTD beverage ingredients, or merchandise, including disruptions caused by external factors; ongoing risks related to supply chain volatility and reliability, including tariffs, political and climate risks; fluctuations in the market for high-quality coffee beans and other key commodities; unpredictable changes in the cost and availability of real estate, labor, raw materials, equipment, transportation, or shipping; failure to successfully improve profitability of existing Black Rifle Coffee shops, including challenges or delays with the implementation of operational and strategic changes; risks related to long-term, non-cancelable lease obligations and other real estate-related concerns; inability of franchise partners to successfully operate and manage their franchise locations; failure to maintain high-quality customer experiences for retail partners and end users, including production defects or issues caused by co-manufacturers that negatively impact product quality and brand reputation; failure to comply with food safety regulations or maintain product quality standards; difficulties in successfully expanding into new domestic and international markets; failure to comply with federal, state, and local laws and regulations, or inability to prevail in civil litigation matters; risks related to potential unionization of employees; failure to execute our operational improvement plan to reduce costs and improve efficiency of certain company- wide functions; failure to protect against cybersecurity threats, software vulnerabilities, or hardware security risks; and other risks and uncertainties indicated in our Annual Report on Form 10-K for the year ended December 31, 2024 filed with the Securities and Exchange Commission (the “SEC”) on March 3, 2025 including those set forth under “Item 1A. Risk Factors” included therein, as well as in our other filings with the SEC. Such forward-looking statements are based on information available as of the date of this presentation and the Company’s current beliefs and expectations concerning future developments and their effects on the Company, and speak only as of the date of this presentation. Because forward-looking statements are inherently subject to risks and uncertainties, some of which cannot be predicted or quantified, you should not place undue reliance on these forward-looking statements as predictions of future events. Although the Company believes that it has a reasonable basis for each forward-looking statement contained in this presentation, the Company cannot guarantee that the future results, growth, performance or events or circumstances reflected in these forward-looking statements will be achieved or occur at all. The Company does not undertake any obligation to update or revise any forward-looking statements, whether as a result of new information, future events or otherwise, except as may be required under applicable securities laws. Industry and Market Data This presentation also contains estimates and other statistical data made by independent parties and by the Company relating to market size and growth and other data about the Company’s industry. This data involves a number of assumptions and limitations, and you are cautioned not to give undue weight to such estimates. In addition, projections, assumptions, and estimates of the future performance of the markets in which the Company operates are necessarily subject to a high degree of uncertainty and risk. Industry publications and third-party research, surveys and studies generally indicate that their information has been obtained from sources believed to be reliable, although they do not guarantee the accuracy or completeness of such information. Our estimates of the potential market opportunities for our product candidates include several key assumptions based on our industry knowledge, industry publications, third-party research and other surveys, which may be based on a small sample size and may fail to accurately reflect market opportunities. While we believe that our internal assumptions are reasonable, and management is responsible for the accuracy of such assumptions and data, no independent source has verified such assumptions. Any trademarks, service marks, trade names and copyrights of the Company and other companies contained in this presentation are the property of their respective owners.
2 DISCLAIMER Non-GAAP Financial Measures To evaluate the performance of our business, we rely on both our results of operations recorded in accordance with generally accepted accounting principles in the United States ("GAAP") and certain non-GAAP financial measures, including EBITDA and Adjusted EBITDA. These measures, as defined below, are not defined or calculated under principles, standards or rules that comprise GAAP. Accordingly, the non-GAAP financial measures we use and refer to should not be viewed as a substitute for performance measures derived in accordance with GAAP. Our definitions of EBITDA and Adjusted EBITDA described below are specific to our business and you should not assume that they are comparable to similarly titled financial measures of other companies. Further information relevant to the interpretation of non-GAAP financial measures, and reconciliations of these non-GAAP financial measures to the most comparable GAAP measures, may be found in Slide 18 of this presentation. We define EBITDA as net income (loss) before interest, tax expense, depreciation and amortization expense. We define Adjusted EBITDA, as adjusted for equity-based compensation, system implementation costs, executive recruiting and severance, write-off of site development costs, strategic initiative related costs, non-routine legal expenses, RTD start-up production issues, (gain) loss on assets held for sale, contract termination costs and restructuring fees and related costs. When used in conjunction with GAAP financial measures, we believe that EBITDA and Adjusted EBITDA are useful supplemental measures of operating performance and liquidity because these measures facilitate comparisons of historical performance by excluding non-cash items such as equity-based compensation and other amounts not directly attributable to our primary operations, such as system implementation costs, write-off of site development costs, non-routing legal expense, restructuring fees and related costs, RTD transformation costs and loss on impairment of assets. Adjusted EBITDA is also a key metric used internally by our management to evaluate performance and develop internal budgets and forecasts. EBITDA and Adjusted EBITDA have limitations as an analytical tool and should not be considered in isolation or as a substitute for analyzing our results as reported under GAAP and may not provide a complete understanding of our operating results as a whole. Some of these limitations are (i) they do not reflect changes in, or cash requirements for, our working capital needs, (ii) they do not reflect our interest expense or the cash requirements necessary to service interest or principal payments on our debt, (iii) they do not reflect our tax expense or the cash requirements to pay our taxes, (iv) they do not reflect historical capital expenditures or future requirements for capital expenditures or contractual commitments, (v) although equity-based compensation expenses are non-cash charges, we rely on equity compensation to compensate and incentivize employees, directors and certain consultants, and we may continue to do so in the future and (vi) although depreciation, amortization and impairments are non-cash charges, the assets being depreciated and amortized will often have to be replaced in the future, and these non-GAAP measures do not reflect any cash requirements for such replacements. Forward Looking Non-GAAP Financial Measures Forward Looking Non-GAAP Financial Measures This presentation also includes certain forward-looking non-GAAP financial measures, specifically Adjusted EBITDA. We have not reconciled forward-looking Adjusted EBITDA to its most directly comparable GAAP measure, net income (loss), in reliance on the unreasonable efforts exception provided under Item 10(e)(1)(i)(B) of Regulation S-K. We cannot predict with reasonable certainty the ultimate outcome of certain components of such reconciliation, including market-related assumptions that are not within our control, or others that may arise, without unreasonable effort. For these reasons, we are unable to assess the probable significance of the unavailable information, which could materially impact the amount of future net income (loss). See “Non-GAAP Financial Measures” for additional important information regarding Adjusted EBITDA. Use of Projections This presentation contains financial forecasts with respect to the Company’s projected financial results, including Revenue, Gross Margin and Adjusted EBITDA, for the Company’s fiscal years through 2027. The Company’s independent auditors have not audited, reviewed, compiled or performed any procedures with respect to the projections for the purpose of their inclusion in this presentation, and accordingly, they did not express an opinion or provide any other form of assurance with respect thereto for the purpose of this presentation. These projections should not be relied upon as being necessarily indicative of future results. The assumptions and estimates underlying the prospective financial information are inherently uncertain and are subject to a wide variety of significant business, economic and competitive risks and uncertainties that could cause actual results to differ materially from those contained in the prospective financial information. Accordingly, there can be no assurance that the prospective results are indicative of the future performance of the Company or that actual results will not differ materially from those presented in the prospective financial information. Inclusion of the prospective financial information in this presentation should not be regarded as a representation by any person that the results contained in the prospective financial information will be achieved.
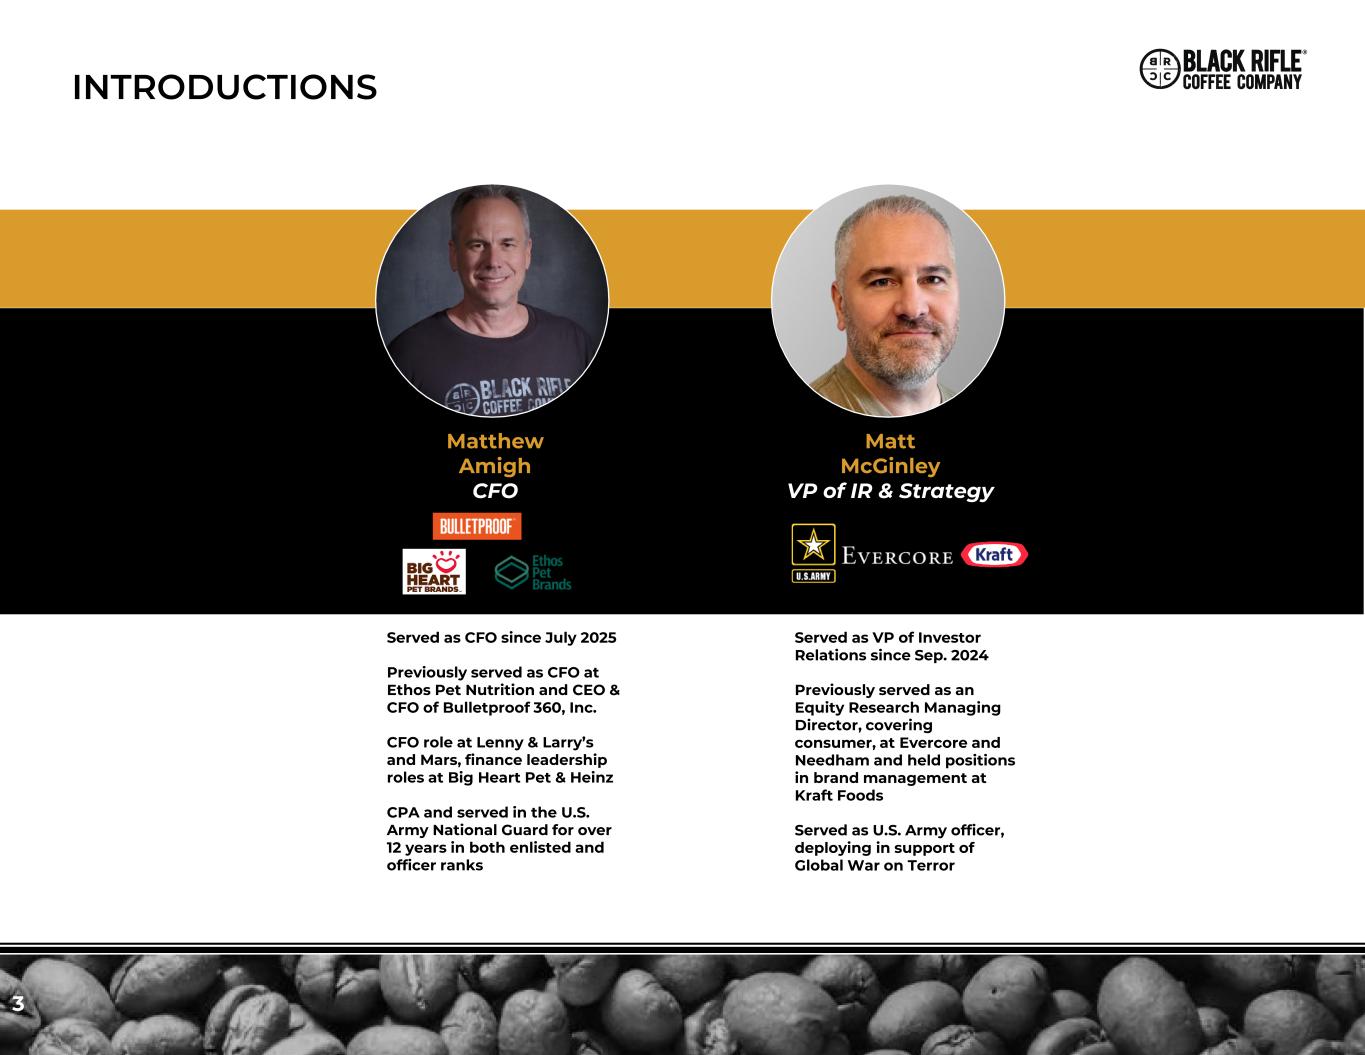
3 INTRODUCTIONS Served as CFO since July 2025 Previously served as CFO at Ethos Pet Nutrition and CEO & CFO of Bulletproof 360, Inc. CFO role at Lenny & Larry’s and Mars, finance leadership roles at Big Heart Pet & Heinz CPA and served in the U.S. Army National Guard for over 12 years in both enlisted and officer ranks Matthew Amigh CFO Served as VP of Investor Relations since Sep. 2024 Previously served as an Equity Research Managing Director, covering consumer, at Evercore and Needham and held positions in brand management at Kraft Foods Served as U.S. Army officer, deploying in support of Global War on Terror Matt McGinley VP of IR & Strategy

~30% CAGR 2019A 2021A2020A 2023A2022A 2024A 2025E $82 $164 $233 $301 $396 $391 $395+ Net Revenue ($ million) 4 COMPANY OVERVIEW & GROWTH STRATEGY Differentiated brand and disruptive presence across large beverage categories, with operational efficiency gains creating conditions for scalable growth and margin leverage 2021A Revenue by Channel (%) 2021A Net Revenue: $233mm holesale 24 utpost 5 DTC 71 2024A Revenue by Channel (%) 2024A Net Revenue: $391mmWholesale 62% DTC 32% Outpost 6% DISRUPTIVE IN LARGE CATEGORIES OPERATIONAL EFFICIENCY GAINSEVOLUTION OF BUSINESS • Launched as a DTC brand • Established a dedicated and loyal fan base • Evolving channel mix post-COVID into wholesale business sold primarily thru FDM retail • Premium positioning with an authentic edge • Providing disruptive growth: • #3 RTD Coffee Brand1 • #4 Bagged Coffee brand at Walmart2 • We expect future Wholesale growth based on: • Expanding into new retail banners • Deepening penetration with existing customers • Increasing average items carried per store • Small share gains in multi-billion- dollar categories = opportunity for substantial revenue growth • Streamlined operations by headcount realignment and substantial reduction in opex • Optimized asset base including 50% reduction in working capital 920 470 4Q 2022 3Q 2025 (49%) Headcount Packaged Coffee Ready-to- Drink Coffee Energy Market Size3 $13B $4B $23B BRCC ACV%4 54% 53% 22% 1. Nielsen IQ: Total US xAOC+Conv. L52 weeks ending 09/27/2025 2. Nielsen IQ: Walmart, L52 weeks ending 09/27/2025 3. Nielsen IQ: Total US xAOC+Conv. L52 weeks ending 09/27/2025 4. Nielsen IQ: Total US xAOC+Conv. L4 weeks ending 09/27/2025

COMMUNITY FOCUSED • We stand for the communities we serve – as our investor value creation increases, so does our mission PREMIUM POSITIONED • We offer curated; expertly roasted coffee delivered in all formats, including RTD, a high- end, zero-sugar energy drink, an engaging Outpost experience and differentiated brand merchandise AUTHENTICITY MATTERS • Our brand stands with those who serve — and those who love them. e’re emotional, sometimes edgy, and always proud to spotlight the fun and the fight of the Veteran and First Responder community. VETERAN FOUNDED • We carry the culture of those we serve including an unabashed love for America and all that makes her great! 5 BRCC is proudly committed to our mission of supporting those who serve, standing for more than high-quality coffee WHO WE ARE WE ARE A VETERAN-FOUNDED BUSINESS OPERATED BY PRINCIPLED MEN AND WOMEN WHO HONOR THOSE WHO PROTECT, DEFEND AND SUPPORT OUR COUNTRY OUR FOUR PILLARS OF BRAND IDENTITY
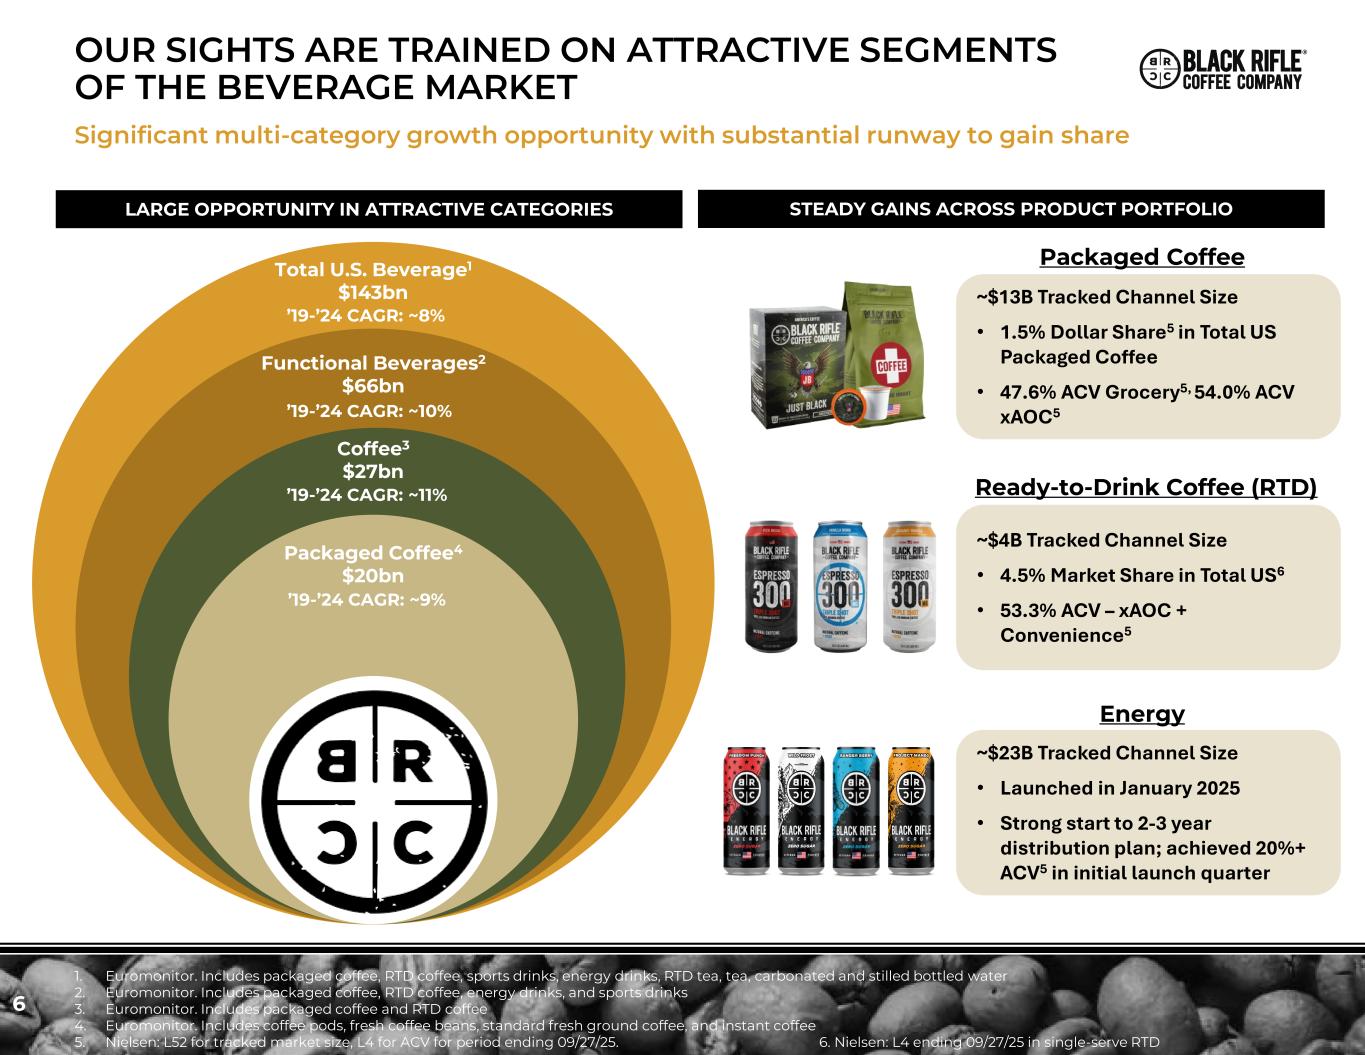
6 OUR SIGHTS ARE TRAINED ON ATTRACTIVE SEGMENTS OF THE BEVERAGE MARKET LARGE OPPORTUNITY IN ATTRACTIVE CATEGORIES 1. Euromonitor. Includes packaged coffee, RTD coffee, sports drinks, energy drinks, RTD tea, tea, carbonated and stilled bottled water 2. Euromonitor. Includes packaged coffee, RTD coffee, energy drinks, and sports drinks 3. Euromonitor. Includes packaged coffee and RTD coffee 4. Euromonitor. Includes coffee pods, fresh coffee beans, standard fresh ground coffee, and instant coffee 5. Nielsen: L52 for tracked market size, L4 for ACV for period ending 09/27/25. 6. Nielsen: L4 ending 09/27/25 in single-serve RTD Significant multi-category growth opportunity with substantial runway to gain share Packaged Coffee4 $20bn Coffee3 $27bn Functional Beverages2 $66bn Total U.S. Beverage1 $143bn ’19-’24 CAGR: ~9% ’19-’24 CAGR: ~11% ’19-’24 CAGR: ~10% ’19-’24 CAGR: ~8% STEADY GAINS ACROSS PRODUCT PORTFOLIO ~$13B Tracked Channel Size • 1.5% Dollar Share5 in Total US Packaged Coffee • 47.6% ACV Grocery5, 54.0% ACV xAOC5 Packaged Coffee ~$4B Tracked Channel Size • 4.5% Market Share in Total US6 • 53.3% ACV – xAOC + Convenience5 Ready-to-Drink Coffee (RTD) ~$23B Tracked Channel Size • Launched in January 2025 • Strong start to 2-3 year distribution plan; achieved 20%+ ACV5 in initial launch quarter Energy

BRCC offers whole bean and ground bagged & single-serve coffee products nationwide 7 STRATEGY / COFFEE OFFERING DISTRIBUTION GROWTH1 SELECT KEY CUSTOMERS • Broad range of roasts and flavors in bagged and single-serve formats • Strict quality standards and one-of-a-kind branding is a core focus for BRCC; all beans sourced from long- standing trusted partners • All rounds / K-Cups manufactured exclusively by Keurig Dr Pepper (KDP), the single-serve market leader • Significant whitespace remains in terms of ACV, SKUs and retail partners to continue to penetrate the category 1. Nielsen Total US Food, Total US xAOC. 4-Week periods ending closest to each Quarter's end-date STRONG POSITION IN WHOLESALE COFFEE WITH ADDITIONAL ROOM FOR GROWTH Wholesale + Convenience DTC Outpost Bags & Rounds GROWTH STRATEGY • BRCC continues to expand distribution and gain market share in wholesale through “Land and Expand” strategy • ACV in Wholesale 54.1%1 as of Q3 2025 • Future Wholesale growth based on: • Landing new retail banners and channels • Expanding with existing customers by increasing average items carried per store to drive shelf presence • Targeting ~70% - 80% ACV over the next ~24 months 45.0 54.1 41.7 47.6 Q1 Q2 Q3 Q4 Q1 Q2 Q3 Q4 Q1 Q2 Q3 Q4 Q1 Q2 Q3 A C V BRCC xAOC BRCC Grocery 2022 2023 2024 2025

UNIT DRIVEN GROWTH REFLECTS REAL CONSUMER DEMAND 8 BRCC’s branding and focus on quality products have driven outsized growth compared to legacy brands PACKAGED COFFEE RETAIL SALES1 1. Nielsen IQ, Total US xAOC, Dollar Sales, Total Packaged Coffee Sales, L52 through 9/27/2025 2. Nielsen IQ, Total US xAOC, % Change in Dollar Sales, Total Packaged Coffee Sales, YTD through 9/27/2025 3. Nielsen IQ, Total US xAOC, EQ % Change, Total Packaged Coffee Sales, YTD through 9/27/2025 4. Nielsen IQ, Total US xAOC, Average EQ % Price Change, Total Packaged Coffee Sales, YTD through 9/27/2025 Wholesale + Convenience DTC Outpost Bags & Rounds 30.5% 28.5% 15.7% 6.9% 4.5% 3.0% 1.2% (0.1)% (1.3)% (2.8)% (3.2)% 463 Annual Retail Sales ($ million)1 185 640 2372,005 1,863 78355 504874 487 BRCC Stands Out for Unit Growth in a Price-Driven Category Unit Growth3 10.3% 20.7% (1.0)% (12.7)% 0.4% (2.0)% 1.1% (5.4)% (7.3)% (11.0)% (9.3)% Pricing Growth4 18.3% 6.4% 16.9% 22.4% 4.1% 5.0% 0.1% 5.6% 6.5% 9.3% 6.7% Retail Sales Growth YTD2
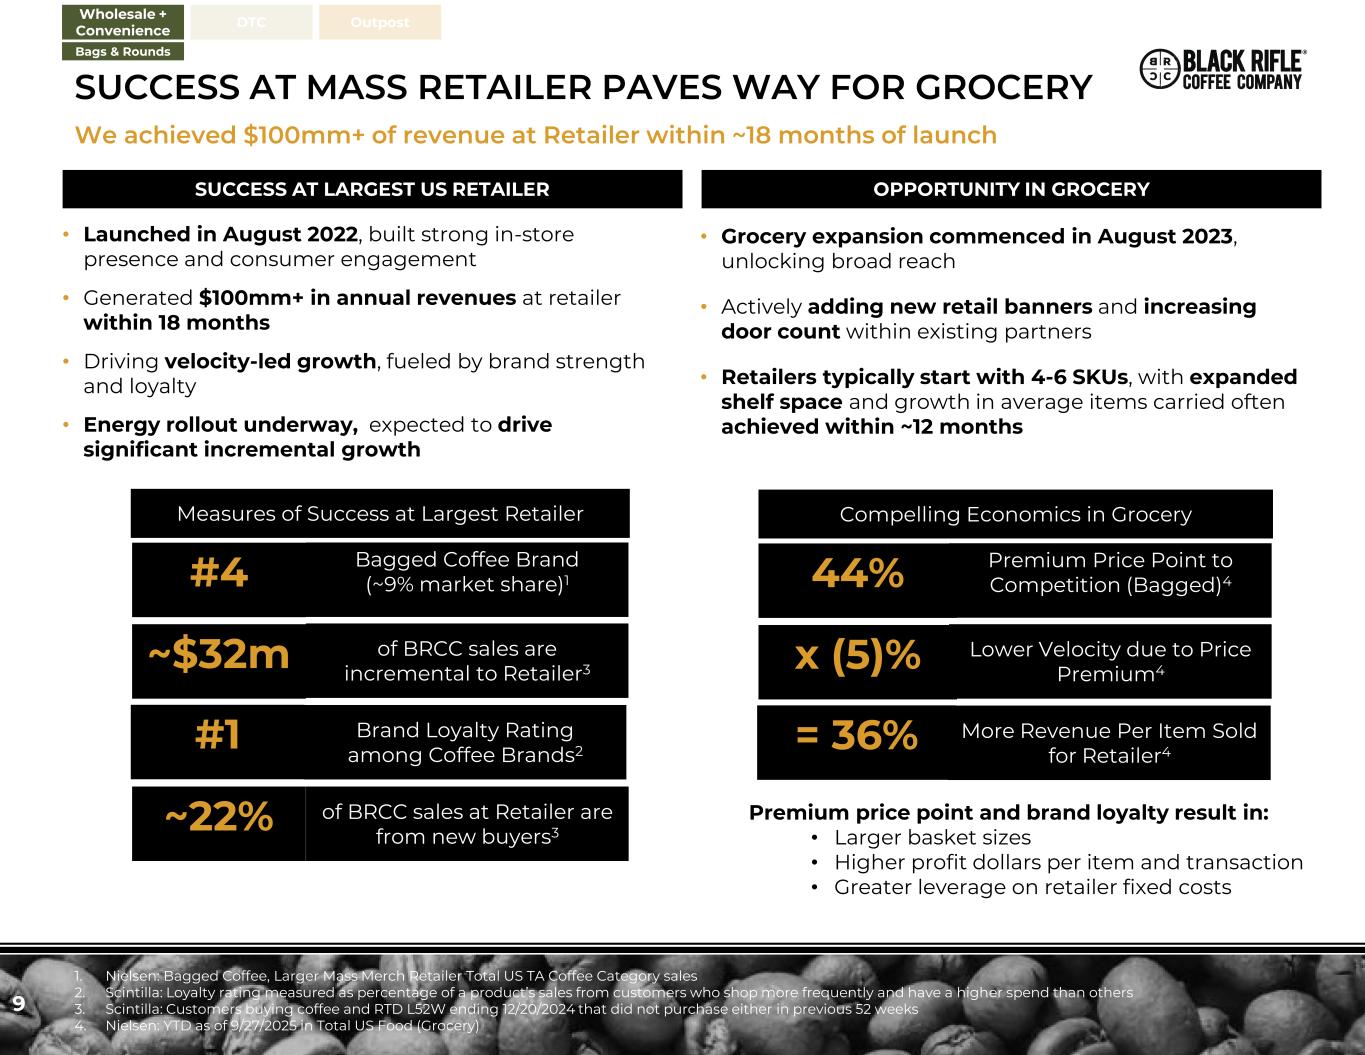
9 SUCCESS AT MASS RETAILER PAVES WAY FOR GROCERY We achieved $100mm+ of revenue at Retailer within ~18 months of launch #4 ~22% ~$32m SUCCESS AT LARGEST US RETAILER 1. Nielsen: Bagged Coffee, Larger Mass Merch Retailer Total US TA Coffee Category sales 2. Scintilla: Loyalty rating measured as percentage of a product’s sales from customers who shop more frequently and have a higher spend than others 3. Scintilla: Customers buying coffee and RTD L52W ending 12/20/2024 that did not purchase either in previous 52 weeks 4. Nielsen: YTD as of 9/27/2025 in Total US Food (Grocery) Wholesale + Convenience DTC Outpost Bags & Rounds #1 OPPORTUNITY IN GROCERY Bagged Coffee Brand (~9% market share)1 of BRCC sales are incremental to Retailer3 Brand Loyalty Rating among Coffee Brands2 of BRCC sales at Retailer are from new buyers3 Measures of Success at Largest Retailer 44% x (5)% = 36% Premium Price Point to Competition (Bagged)4 Lower Velocity due to Price Premium4 More Revenue Per Item Sold for Retailer4 Premium price point and brand loyalty result in: • Larger basket sizes • Higher profit dollars per item and transaction • Greater leverage on retailer fixed costs Compelling Economics in Grocery • Launched in August 2022, built strong in-store presence and consumer engagement • Generated $100mm+ in annual revenues at retailer within 18 months • Driving velocity-led growth, fueled by brand strength and loyalty • Energy rollout underway, expected to drive significant incremental growth • Grocery expansion commenced in August 2023, unlocking broad reach • Actively adding new retail banners and increasing door count within existing partners • Retailers typically start with 4-6 SKUs, with expanded shelf space and growth in average items carried often achieved within ~12 months
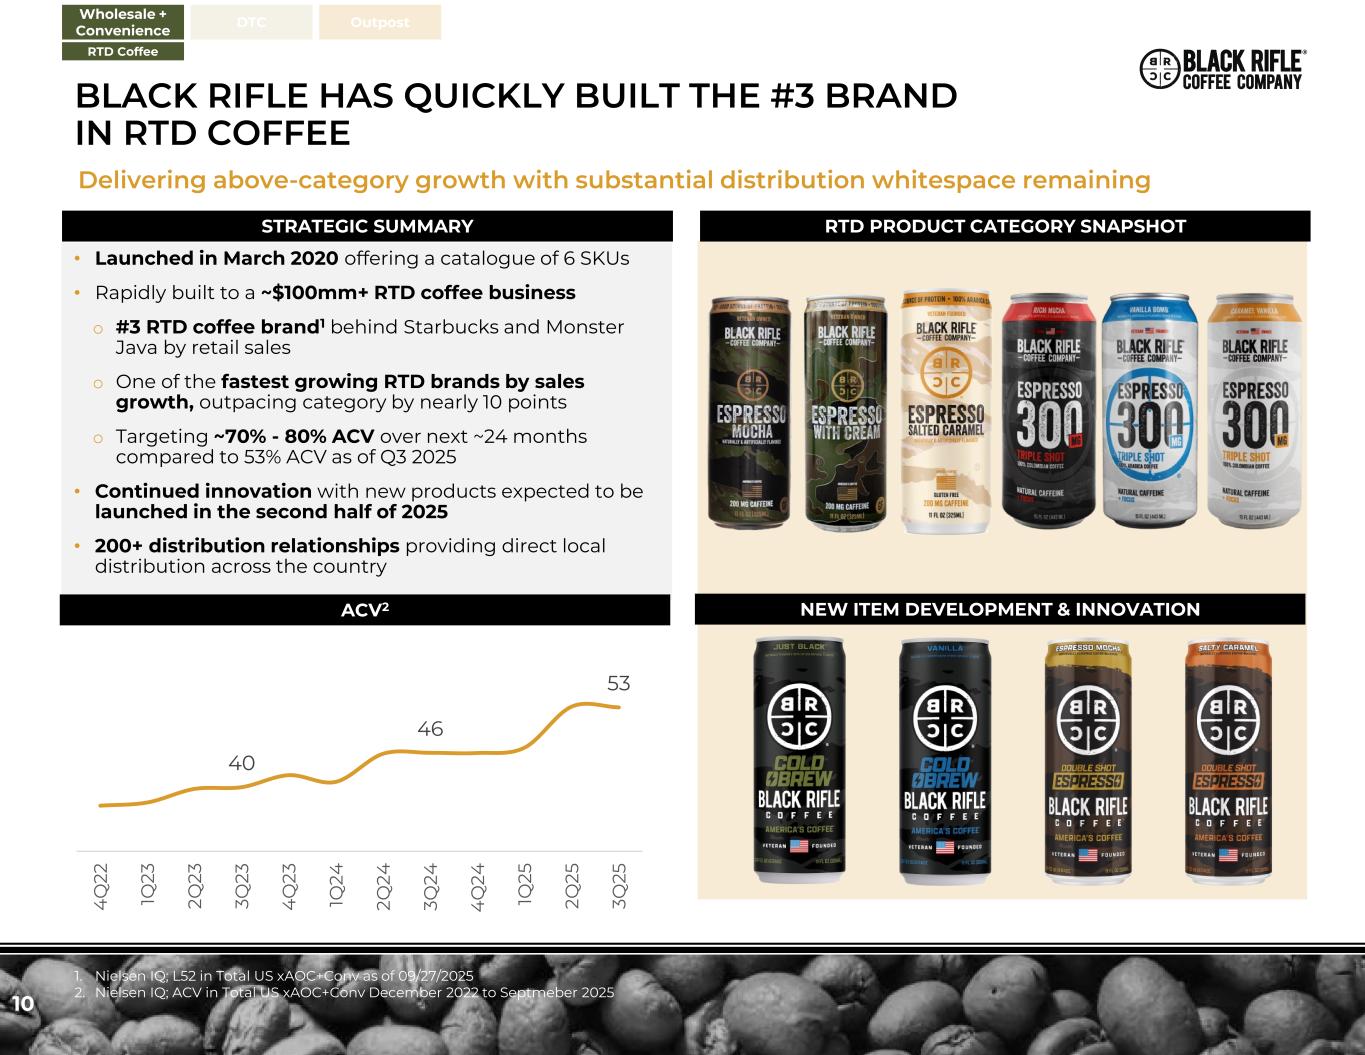
Delivering above-category growth with substantial distribution whitespace remaining 10 STRATEGIC SUMMARY • Launched in March 2020 offering a catalogue of 6 SKUs • Rapidly built to a ~$100mm+ RTD coffee business o #3 RTD coffee brand1 behind Starbucks and Monster Java by retail sales o One of the fastest growing RTD brands by sales growth, outpacing category by nearly 10 points o Targeting ~70% - 80% ACV over next ~24 months compared to 53% ACV as of Q3 2025 • Continued innovation with new products expected to be launched in the second half of 2025 • 200+ distribution relationships providing direct local distribution across the country RTD PRODUCT CATEGORY SNAPSHOT 1. Nielsen IQ; L52 in Total US xAOC+Conv as of 09/27/2025 2. Nielsen IQ; ACV in Total US xAOC+Conv December 2022 to Septmeber 2025 Wholesale + Convenience DTC Outpost RTD Coffee BLACK RIFLE HAS QUICKLY BUILT THE #3 BRAND IN RTD COFFEE ACV2 40 46 53 4 Q 22 1Q 23 2Q 23 3Q 23 4 Q 23 1Q 24 2Q 24 3Q 24 4 Q 24 1Q 25 2Q 25 3Q 25 NEW ITEM DEVELOPMENT & INNOVATION
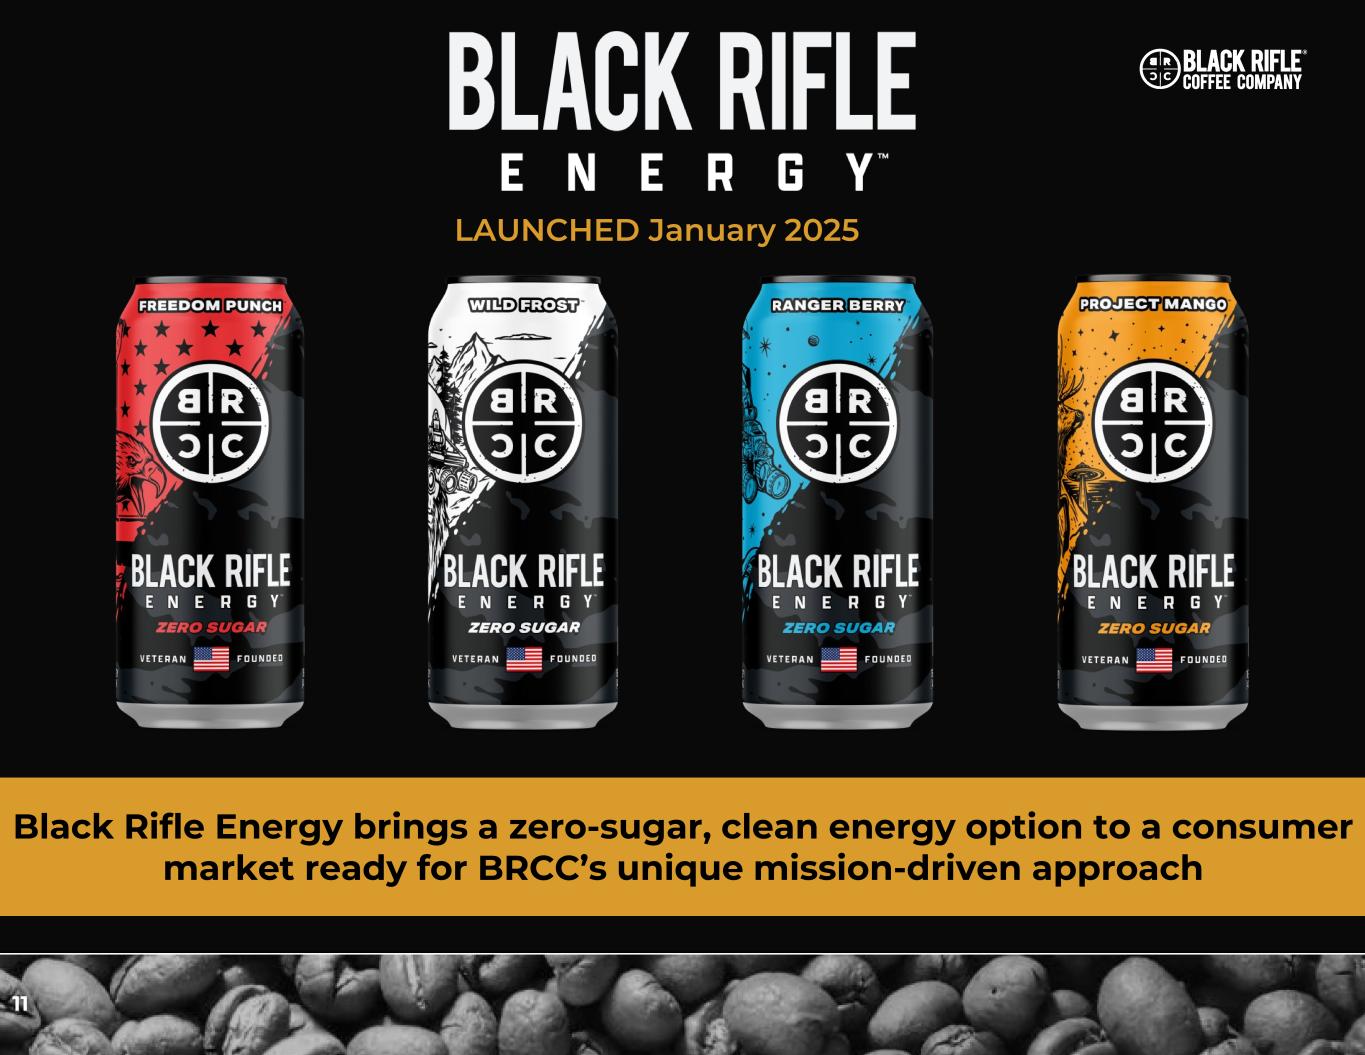
11 Black Rifle Energy brings a zero-sugar, clean energy option to a consumer market ready for BRCC’s unique mission-driven approach LAUNCHED January 2025
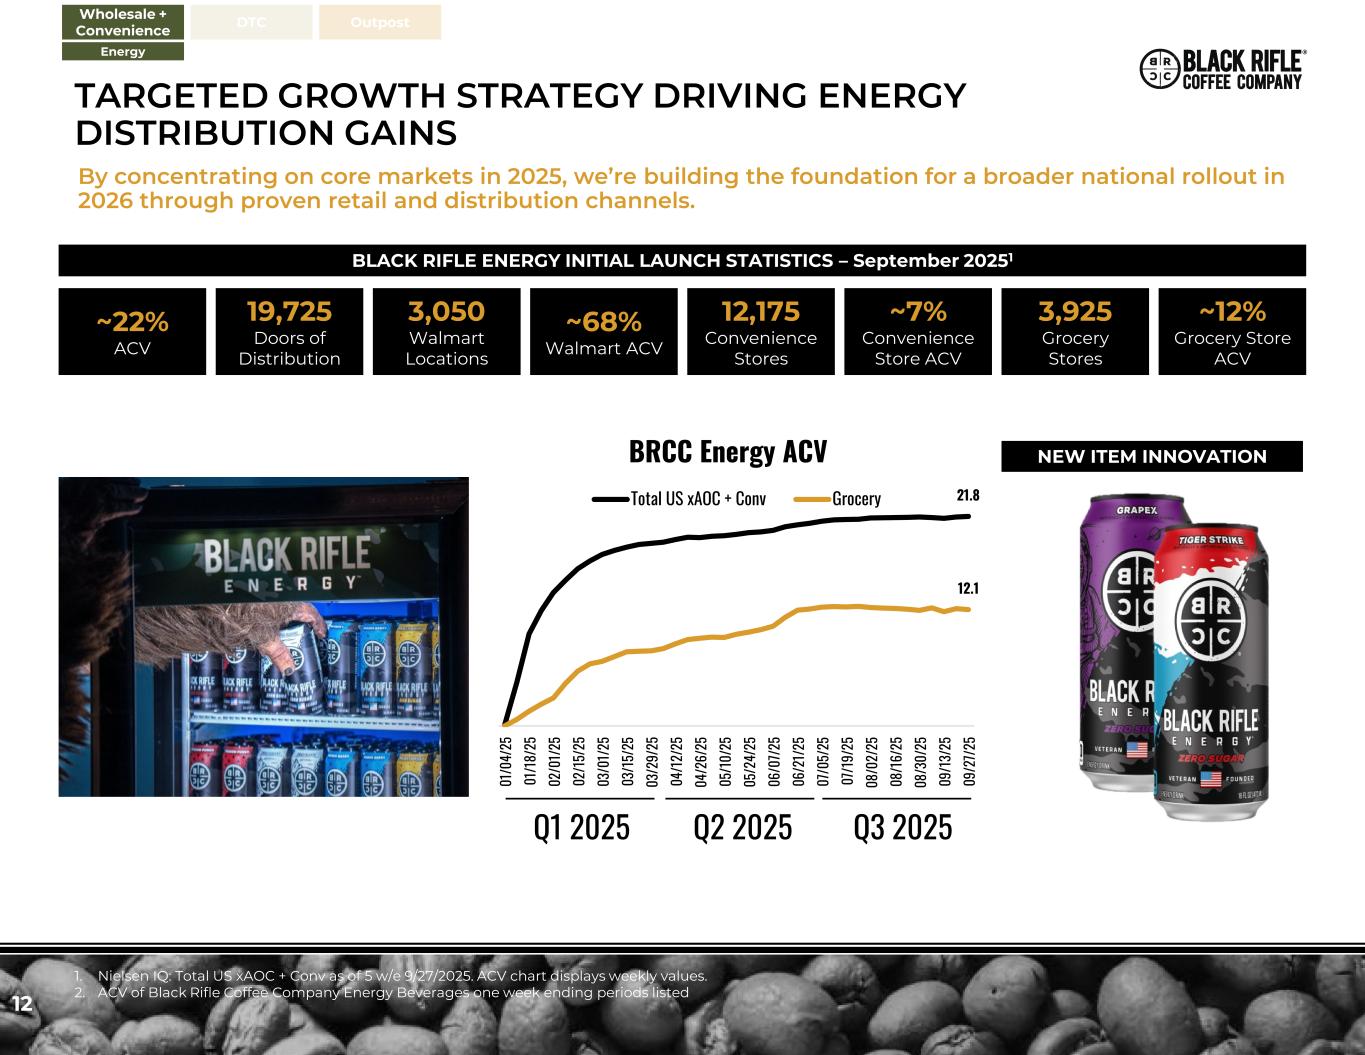
12 ~22% ACV 19,725 Doors of Distribution 3,050 Walmart Locations ~68% Walmart ACV 12,175 Convenience Stores ~7% Convenience Store ACV 3,925 Grocery Stores ~12% Grocery Store ACV BLACK RIFLE ENERGY INITIAL LAUNCH STATISTICS – September 20251 1. Nielsen IQ: Total US xAOC + Conv as of 5 w/e 9/27/2025. ACV chart displays weekly values. 2. ACV of Black Rifle Coffee Company Energy Beverages one week ending periods listed Wholesale + Convenience DTC Outpost Energy TARGETED GROWTH STRATEGY DRIVING ENERGY DISTRIBUTION GAINS By concentrating on core markets in 2025, we’re building the foundation for a broader national rollout in 2026 through proven retail and distribution channels. 21.8 12.1 01 /0 4/ 25 01 /1 8/ 25 02 /0 1/ 25 02 /1 5/ 25 03 /0 1/ 25 03 /1 5/ 25 03 /2 9/ 25 04 /1 2/ 25 04 /2 6/ 25 05 /1 0/ 25 05 /2 4/ 25 06 /0 7/ 25 06 /2 1/ 25 07 /0 5/ 25 07 /1 9/ 25 08 /0 2/ 25 08 /1 6/ 25 08 /3 0/ 25 09 /1 3/ 25 09 /2 7/ 25 AC V % BRCC Energy ACV Total US xAOC + Conv Grocery Q3 2025Q1 2025 Q2 2025 NEW ITEM INNOVATION
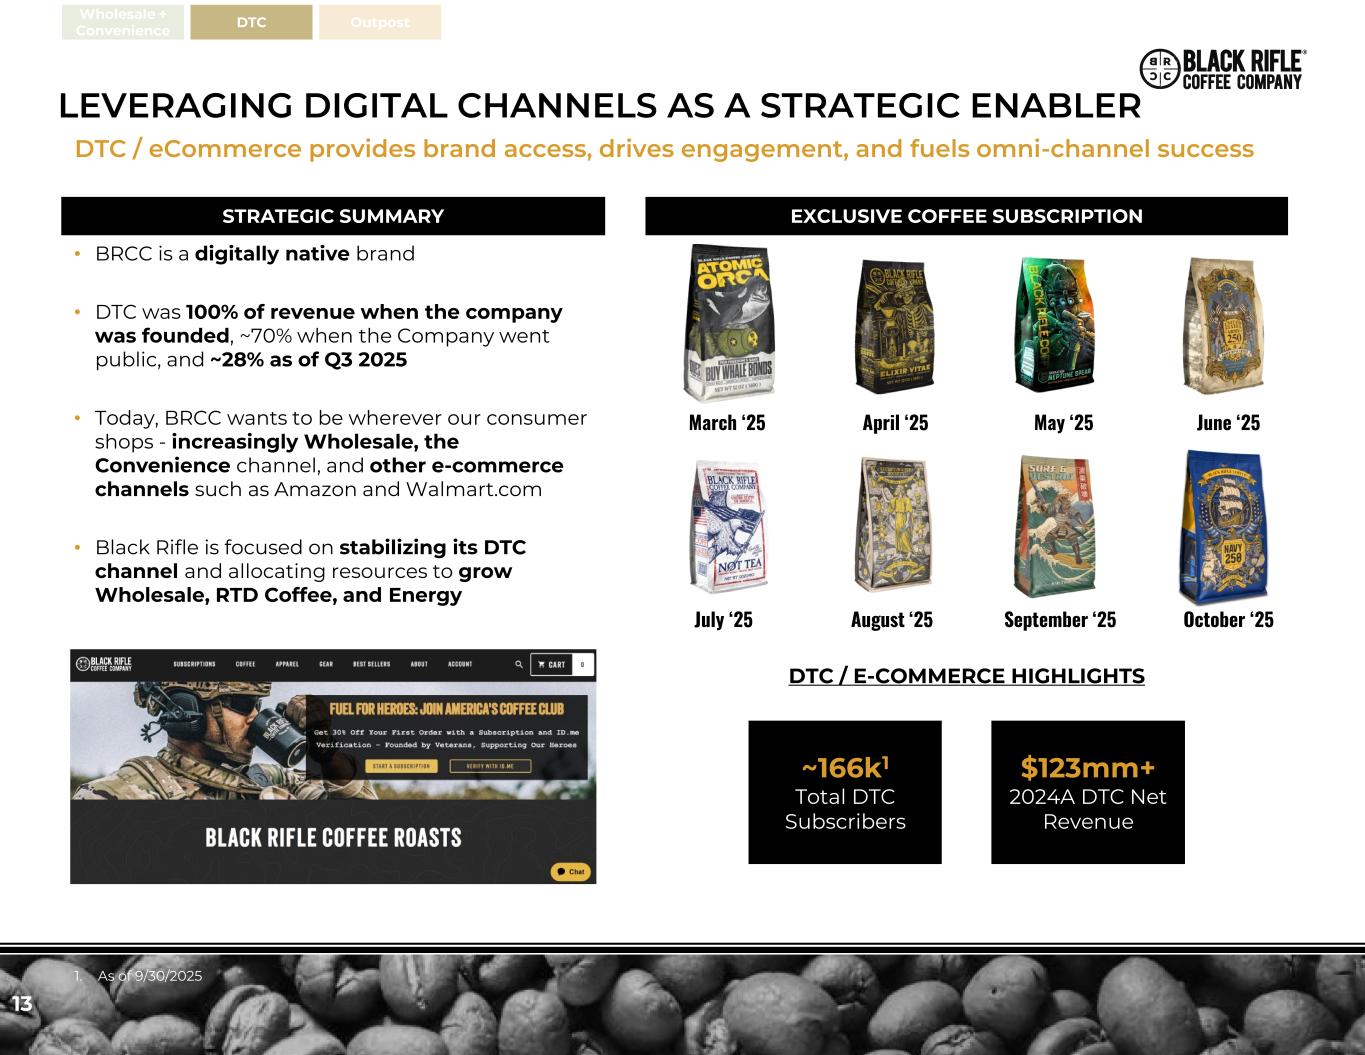
13 DTC / E-COMMERCE HIGHLIGHTS ~166k1 Total DTC Subscribers $123mm+ 2024A DTC Net Revenue • BRCC is a digitally native brand • DTC was 100% of revenue when the company was founded, ~70% when the Company went public, and ~28% as of Q3 2025 • Today, BRCC wants to be wherever our consumer shops - increasingly Wholesale, the Convenience channel, and other e-commerce channels such as Amazon and Walmart.com • Black Rifle is focused on stabilizing its DTC channel and allocating resources to grow Wholesale, RTD Coffee, and Energy STRATEGIC SUMMARY EXCLUSIVE COFFEE SUBSCRIPTION Wholesale + Convenience DTC Outpost LEVERAGING DIGITAL CHANNELS AS A STRATEGIC ENABLER DTC / eCommerce provides brand access, drives engagement, and fuels omni-channel success 1. As of 9/30/2025 July ‘25 June ‘25March ‘25 April ‘25 May ‘25 August ‘25 September ‘25 October ‘25
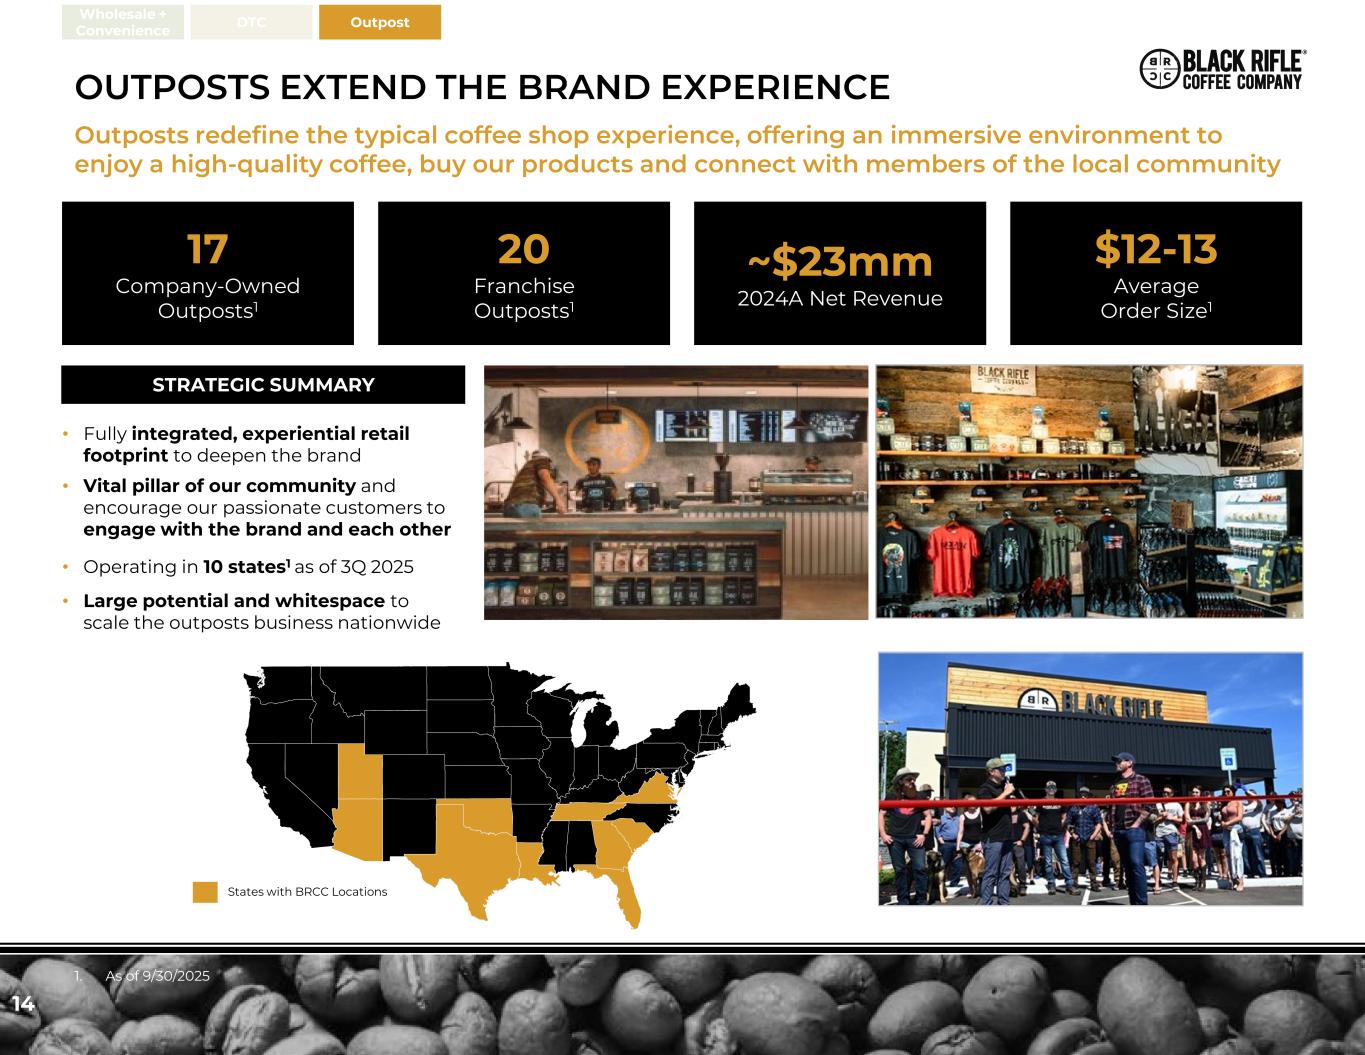
14 OUTPOSTS EXTEND THE BRAND EXPERIENCE Outposts redefine the typical coffee shop experience, offering an immersive environment to enjoy a high-quality coffee, buy our products and connect with members of the local community 17 Company-Owned Outposts1 20 Franchise Outposts1 ~$23mm 2024A Net Revenue $12-13 Average Order Size1 • Fully integrated, experiential retail footprint to deepen the brand • Vital pillar of our community and encourage our passionate customers to engage with the brand and each other • Operating in 10 states1 as of 3Q 2025 • Large potential and whitespace to scale the outposts business nationwide States with BRCC Locations STRATEGIC SUMMARY 1. As of 9/30/2025 Wholesale + Convenience DTC Outpost
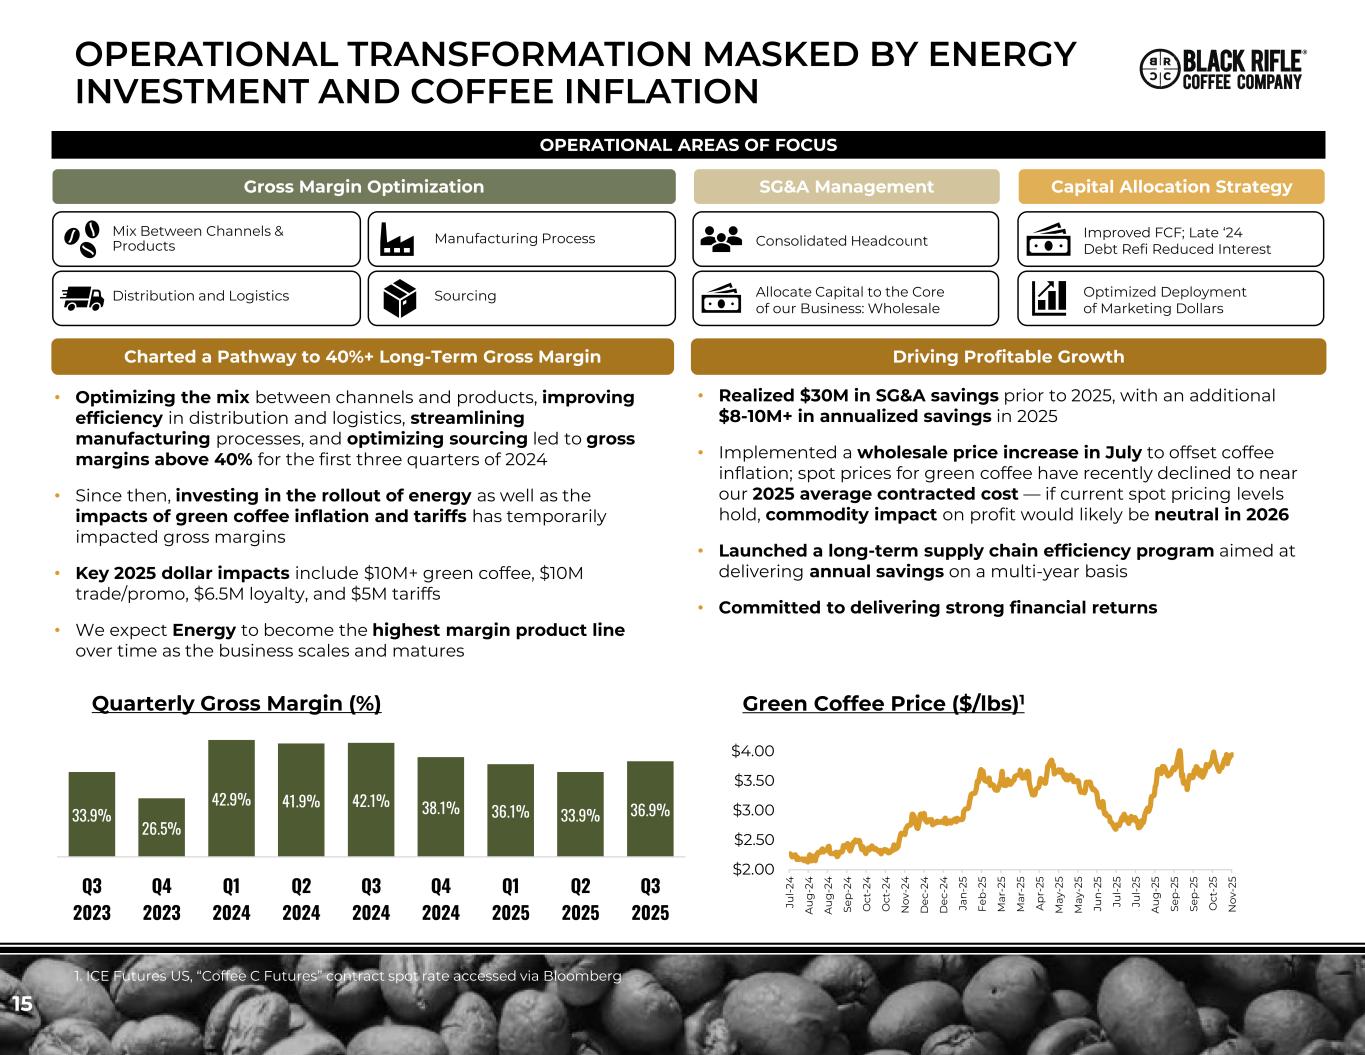
15 OPERATIONAL TRANSFORMATION MASKED BY ENERGY INVESTMENT AND COFFEE INFLATION Distribution and Logistics Sourcing Allocate Capital to the Core of our Business: Wholesale Optimized Deployment of Marketing Dollars Mix Between Channels & Products Manufacturing Process Consolidated Headcount Improved FCF; Late ‘24 Debt Refi Reduced Interest Gross Margin Optimization SG&A Management Capital Allocation Strategy OPERATIONAL AREAS OF FOCUS Charted a Pathway to 40%+ Long-Term Gross Margin Driving Profitable Growth Quarterly Gross Margin (%) Green Coffee Price ($/lbs)1 • Optimizing the mix between channels and products, improving efficiency in distribution and logistics, streamlining manufacturing processes, and optimizing sourcing led to gross margins above 40% for the first three quarters of 2024 • Since then, investing in the rollout of energy as well as the impacts of green coffee inflation and tariffs has temporarily impacted gross margins • Key 2025 dollar impacts include $10M+ green coffee, $10M trade/promo, $6.5M loyalty, and $5M tariffs • We expect Energy to become the highest margin product line over time as the business scales and matures • Realized $30M in SG&A savings prior to 2025, with an additional $8-10M+ in annualized savings in 2025 • Implemented a wholesale price increase in July to offset coffee inflation; spot prices for green coffee have recently declined to near our 2025 average contracted cost — if current spot pricing levels hold, commodity impact on profit would likely be neutral in 2026 • Launched a long-term supply chain efficiency program aimed at delivering annual savings on a multi-year basis • Committed to delivering strong financial returns 1. ICE Futures US, “Coffee C Futures” contract spot rate accessed via Bloomberg $2.00 $2.50 $3.00 $3.50 $4.00 Ju l- 24 A u g -2 4 A u g -2 4 S ep -2 4 O ct -2 4 O ct -2 4 N o v- 24 D e c- 24 D e c- 24 Ja n -2 5 F eb -2 5 M ar -2 5 M ar -2 5 A p r- 25 M ay -2 5 M ay -2 5 Ju n -2 5 Ju l- 25 Ju l- 25 A u g -2 5 S ep -2 5 S ep -2 5 O ct -2 5 N o v- 25 33.9% 26.5% 42.9% 41.9% 42.1% 38.1% 36.1% 33.9% 36.9% Q3 2023 Q4 2023 Q1 2024 Q2 2024 Q3 2024 Q4 2024 Q1 2025 Q2 2025 Q3 2025
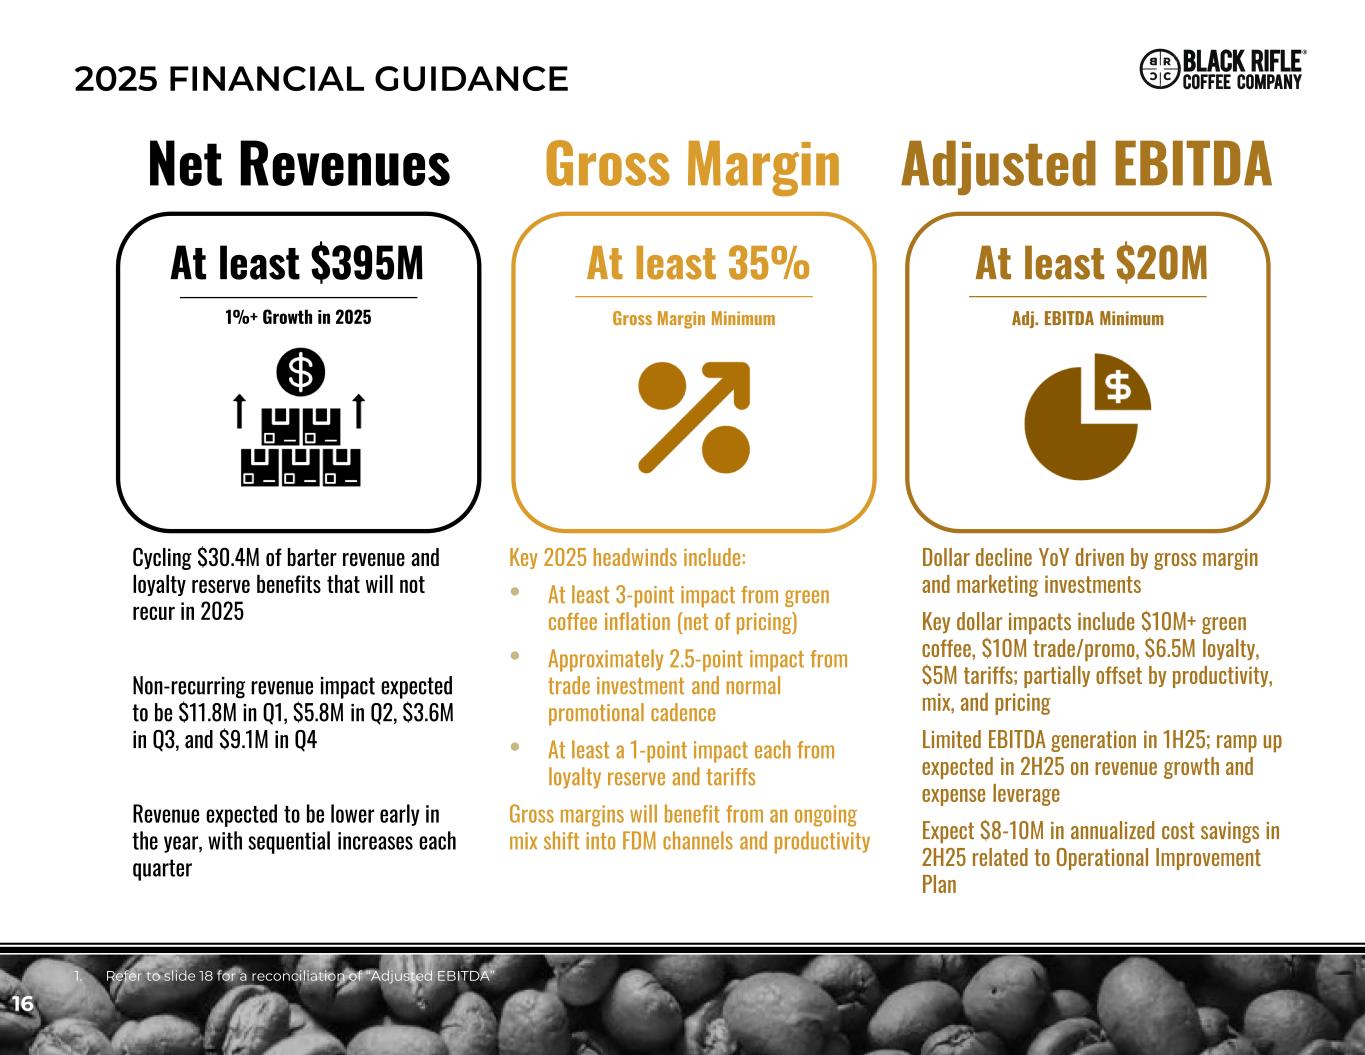
16 2025 FINANCIAL GUIDANCE 1. Refer to slide 18 for a reconciliation of “Adjusted EBITDA” Net Revenues Gross Margin Adjusted EBITDA At least $395M 1%+ Growth in 2025 At least 35% Gross Margin Minimum At least $20M Adj. EBITDA Minimum Cycling $30.4M of barter revenue and loyalty reserve benefits that will not recur in 2025 Non-recurring revenue impact expected to be $11.8M in Q1, $5.8M in Q2, $3.6M in Q3, and $9.1M in Q4 Revenue expected to be lower early in the year, with sequential increases each quarter Key 2025 headwinds include: • At least 3-point impact from green coffee inflation (net of pricing) • Approximately 2.5-point impact from trade investment and normal promotional cadence • At least a 1-point impact each from loyalty reserve and tariffs Gross margins will benefit from an ongoing mix shift into FDM channels and productivity Dollar decline YoY driven by gross margin and marketing investments Key dollar impacts include $10M+ green coffee, $10M trade/promo, $6.5M loyalty, $5M tariffs; partially offset by productivity, mix, and pricing Limited EBITDA generation in 1H25; ramp up expected in 2H25 on revenue growth and expense leverage Expect $8-10M in annualized cost savings in 2H25 related to Operational Improvement Plan
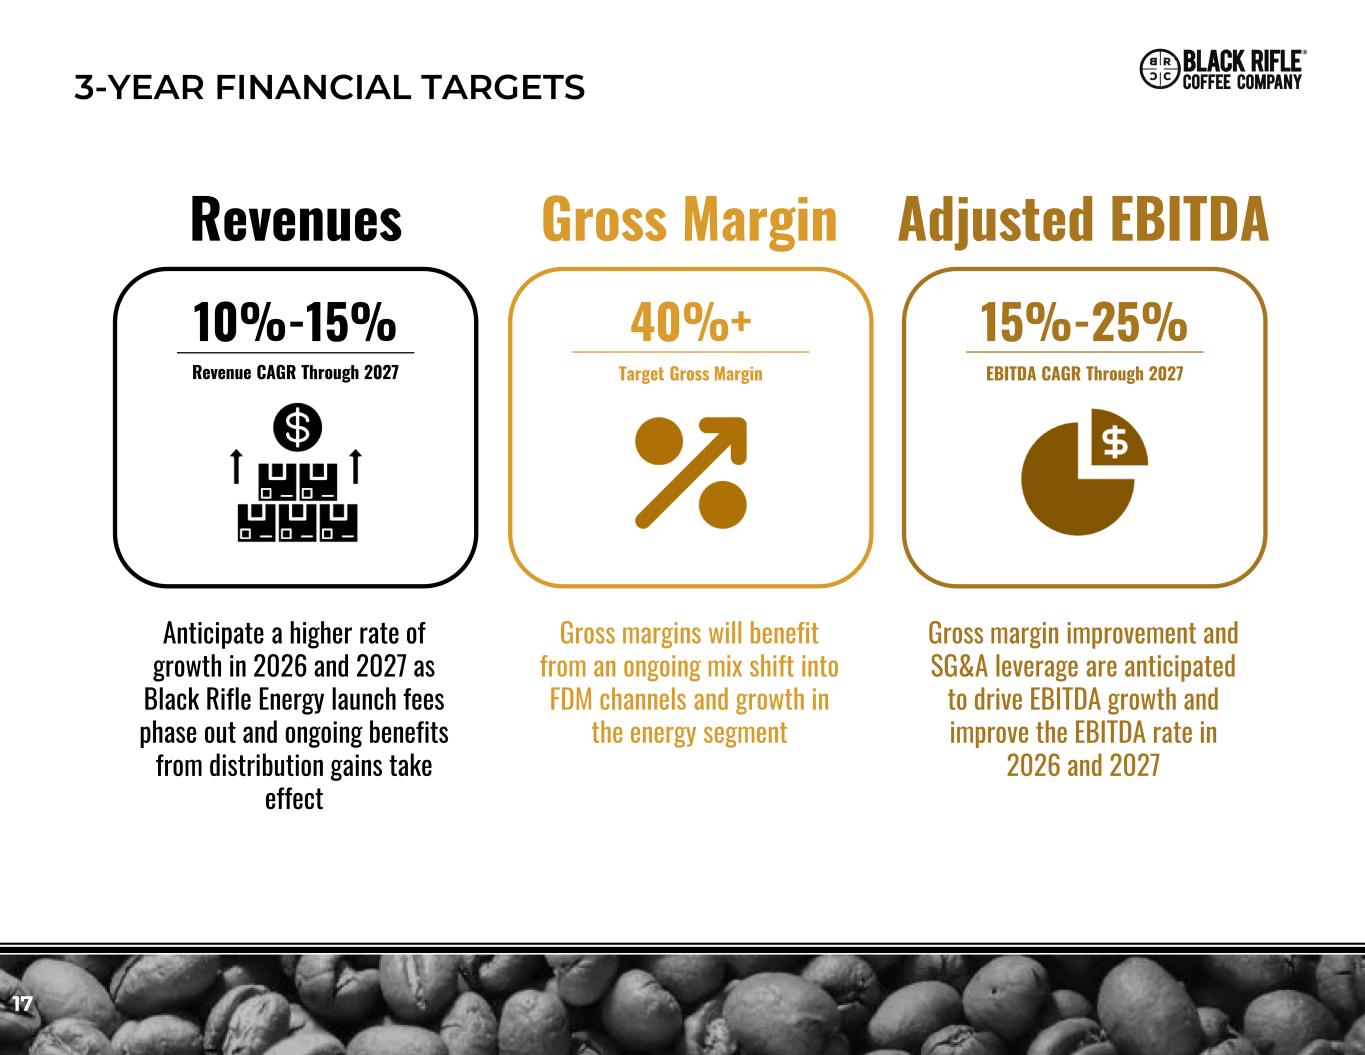
17 3-YEAR FINANCIAL TARGETS Revenues Gross Margin Adjusted EBITDA 10%-15% Revenue CAGR Through 2027 40%+ Target Gross Margin 15%-25% EBITDA CAGR Through 2027 Anticipate a higher rate of growth in 2026 and 2027 as Black Rifle Energy launch fees phase out and ongoing benefits from distribution gains take effect Gross margins will benefit from an ongoing mix shift into FDM channels and growth in the energy segment Gross margin improvement and SG&A leverage are anticipated to drive EBITDA growth and improve the EBITDA rate in 2026 and 2027
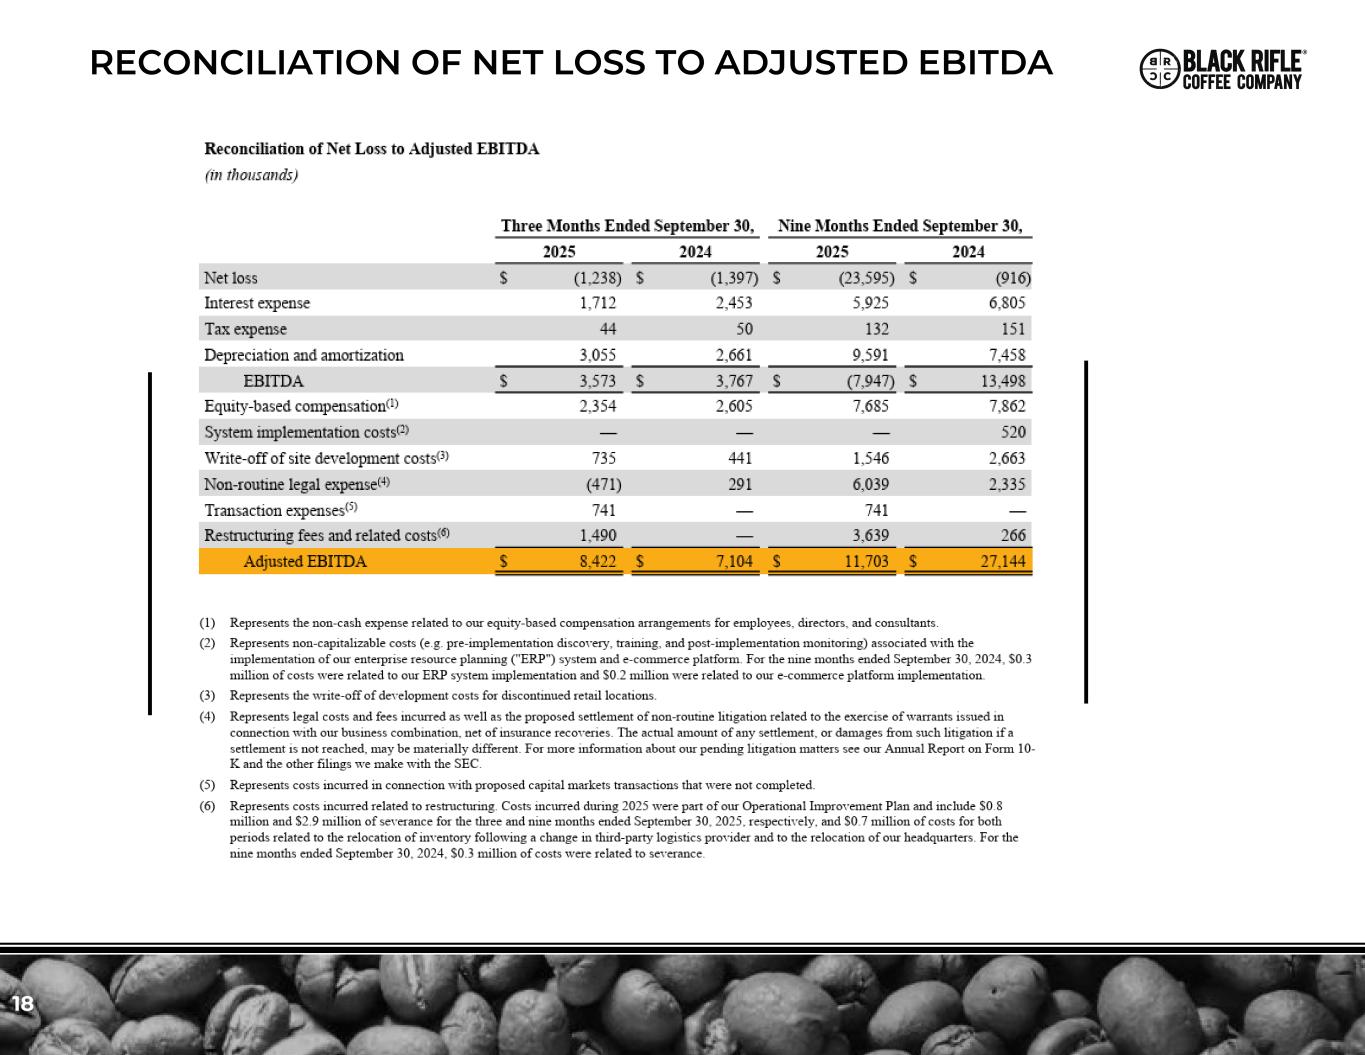
18 RECONCILIATION OF NET LOSS TO ADJUSTED EBITDA
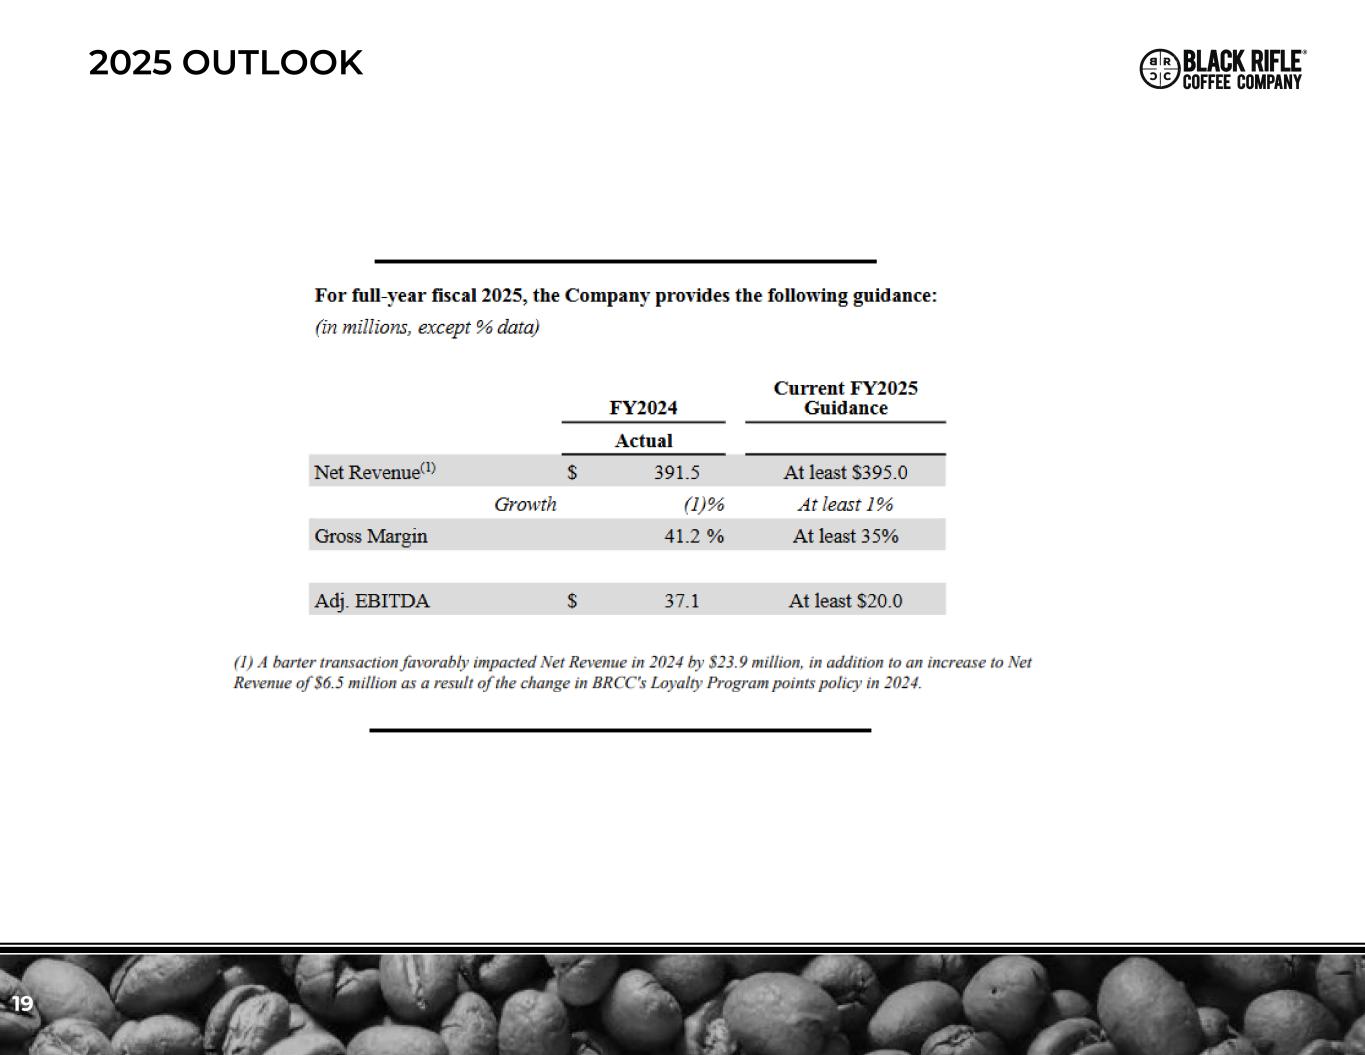
19 2025 OUTLOOK